How to Check Figure Resolution Before Journal Upload
In This Article
Why figure resolution gets rejected so often
If you are preparing a manuscript, you should check figure resolution before the journal upload, not after the submission portal complains. Resolution problems are common because scientific figures pass through many tools: graphing software, image editors, slide decks, PDF exporters, and manuscript systems. Each step can quietly resize, resample, or compress your file.
The frustrating part is that a figure can look fine on your screen and still fail technical checks. Screens hide many problems because they scale images to fit. A journal production system does not care how it looked in PowerPoint or your browser. It checks pixel dimensions, print size, file format, compression, color mode, and sometimes embedded DPI metadata.
This guide gives you a practical pre-submission workflow. You will learn how to inspect pixel size, understand DPI without overthinking it, export figures cleanly, and catch compression damage before upload. We will also point out where journal instructions matter, because the correct answer is often specific to the publisher.
Check figure resolution by starting with final print size
The best way to check figure resolution is to begin with the final size in the journal. A figure that is 3000 pixels wide might be excellent for a single-column image, but weak for a full-width plate. Pixel count only matters when paired with physical print size.
Most journals define figure width in millimeters, centimeters, or inches. Common targets are single column, one and a half column, and double column. Before exporting, find the journal's artwork instructions and note the allowed widths. If the journal does not give exact dimensions, use its template or recently published articles as a guide.
The basic formula is simple: pixels needed equals print size in inches multiplied by required DPI. For example, a 3.5 inch wide line graph at 600 DPI needs 2100 pixels across. A 7 inch wide microscopy panel at 300 DPI needs 2100 pixels across. The same pixel width can satisfy different figure types because line art and image data often have different DPI expectations.
| Figure type | Common minimum | Practical note |
|---|---|---|
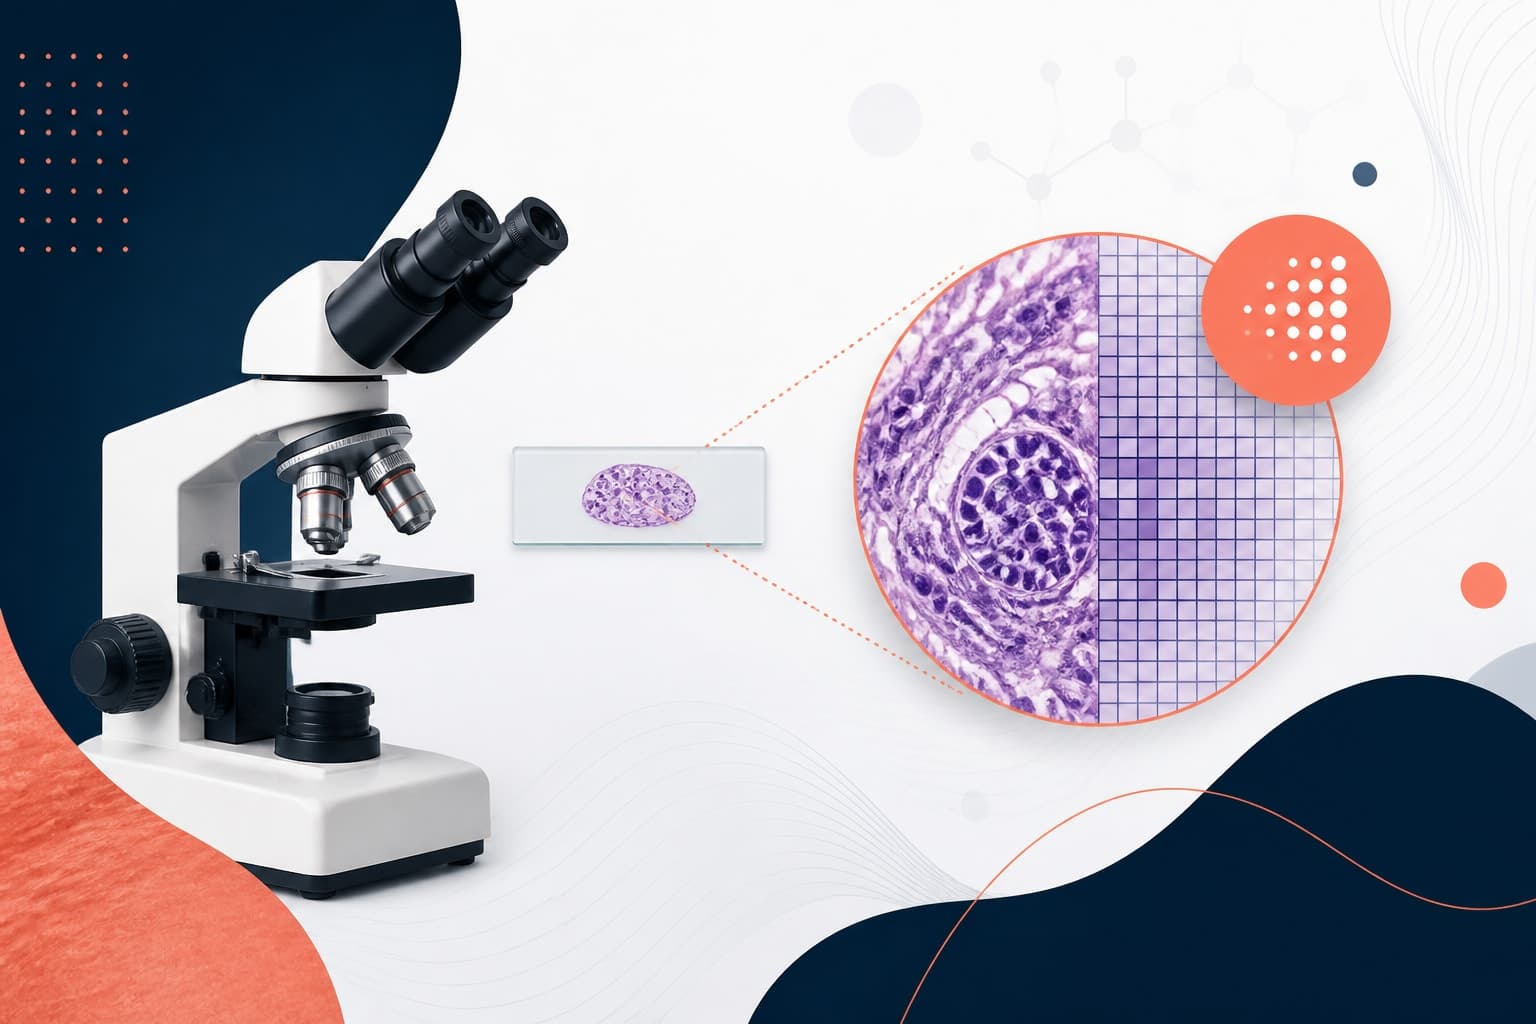
| Photographs and microscopy images | 300 DPI at final size | Preserve real image detail and avoid upsampling. |
| Graphs with text and lines | 600 DPI at final size | Vector export is usually better when accepted. |
| Black and white line art | 1000 to 1200 DPI at final size | Thin lines and labels reveal jagged edges quickly. |
| Mixed panels | Often 500 to 600 DPI | Check the exact journal rule before upload. |
These numbers are not universal. They are a strong starting point, but publisher instructions win. For example, Elsevier provides detailed artwork guidance for formats, resolution, and sizing in its artwork and media instructions. Your target journal may have similar rules hidden under author guidelines, artwork guidelines, or production requirements.
A good habit is to create a small table for your manuscript. List every figure, intended print width, current pixel size, required DPI, and export format. This takes ten minutes and prevents last-minute guessing.
Inspect pixel size before you trust DPI
Pixel dimensions are the real substance of image resolution. DPI metadata tells software how large to print those pixels. It does not create detail by itself. If you only learn one lesson, learn this: a low-pixel image saved at 1200 DPI is still low detail.
To inspect pixel size on macOS, open the file in Preview, choose Tools, then Show Inspector. Look for image width and height in pixels. In Windows, right-click the file, choose Properties, then Details. In many image editors, Image Size or Canvas Size shows pixel dimensions. For TIFF, PNG, and JPEG, this check takes seconds.
For exported PDF figures, the situation is different. PDFs can contain vector objects, raster images, or both. A vector graph may have no fixed pixel size until it is rasterized. That is usually good. Vector lines and text can scale cleanly. If your journal accepts PDF, EPS, or SVG for graphs, use that option unless the instructions say otherwise.
When you check figure resolution for raster images, calculate the effective DPI yourself. Divide pixel width by intended print width in inches. A 1800 pixel image printed at 6 inches wide has 300 effective DPI. The same image printed at 3 inches wide has 600 effective DPI.
Do the calculation for height as well if the journal limits both width and height. Multi-panel figures often fail because one panel is much smaller than the others. When the full figure is reduced to fit the page, the smallest panel loses readable detail first.
Understand DPI without falling for fake resolution
DPI causes confusion because the term is used loosely. You may also see PPI, which means pixels per inch. For journal figures, people often say DPI when they mean effective pixels per inch at final print size. The distinction matters less than the calculation.
Changing DPI metadata without changing pixel dimensions is not the same as improving a figure. If your image is 900 by 600 pixels, setting it to 600 DPI only tells software to print it at 1.5 by 1 inches. It does not add image information. If you print it larger, it will still soften or pixelate.
Upsampling can be useful in limited cases, but it should not be your rescue plan. Resampling software can invent intermediate pixels, which may pass a superficial metadata check. It cannot restore lost microscope detail, rebuild text, or fix a plot exported too small. Journals and reviewers may notice the visual weakness even if the portal accepts the file.
Instead, go back to the source whenever possible. Re-export the graph from the analysis software. Rebuild the layout from original microscopy files. Use a larger canvas. Increase export scale. Keep text and line elements vector when available. These steps produce real quality rather than cosmetic resolution.
When you check figure resolution, ask two questions. First, does the file have enough pixels for the final size? Second, did those pixels come from original data or from a late enlargement? The first question catches technical rejection. The second protects scientific clarity.
Export quality settings that actually matter
Export settings vary by software, but the same principles apply. Set the final figure size before export. Then choose the right format for the content. Avoid building journal figures by repeatedly copying and pasting between apps, because that often rasterizes text and compresses images.
For line graphs, diagrams, and plots, export as PDF, EPS, or SVG if the journal accepts vector files. Vector formats keep lines, labels, and symbols sharp at any size. If raster export is required, choose TIFF or high-quality PNG and set the pixel dimensions directly.
For microscopy, gels, radiology images, photographs, and other raster data, use TIFF when possible. TIFF supports high-quality, lossless workflows and is widely accepted. PNG can also preserve quality for certain image types, especially screenshots and diagrams. JPEG should be used carefully because it applies lossy compression.
In graphing software, look for options such as export width, height, scale factor, resolution, anti-aliasing, font embedding, and transparent background. Do not assume the default is publication-ready. Defaults are often designed for slides or web previews, not journal production.
If you use a layout tool to assemble panels, create the canvas at the final print size. Place images at 100 percent when possible. If you scale images down, that is usually safe. If you scale them up, you are spreading pixels thinner. A 200 percent enlargement should make you pause.
With create with Graffiy, you can design scientific visuals with publication in mind from the beginning. That means fewer rushed fixes after you discover that a beautiful figure was exported at a size meant for a slide, not a journal page.
How to spot compression damage before submission
Compression is one of the quietest ways to damage a figure. It can blur labels, create halos around text, break smooth gradients, and introduce blocky artifacts. The problem is especially visible around sharp edges, such as axis labels, symbols, and panel letters.
To inspect compression, open the exported file at 100 percent and 200 percent zoom. Do not judge only from a zoomed-out view. Look at fine text, thin lines, scale bars, inset labels, and boundaries between high-contrast colors. If letters look fuzzy or surrounded by noise, compression is probably hurting the figure.
JPEG compression deserves special care. A high-quality JPEG may be acceptable for photographic content if the journal allows it. A repeatedly saved JPEG is much riskier. Each save can discard more information. If your source image is already JPEG, avoid saving new working copies as JPEG again.
For graphs and diagrams, JPEG is often the wrong choice. Text and vector-like shapes show artifacts quickly. Use PNG, TIFF, or vector export instead. If a submission portal converts your files, upload the cleanest accepted source format so the conversion starts from a strong file.
PDF compression can also cause trouble. Some PDF exporters downsample images to reduce file size. Look for settings such as image compression, downsampling, optimize for web, smallest file size, or print quality. Choose press quality or high quality print when available. Then reopen the exported file and inspect it again.
File size alone is not proof of quality. A huge file can still contain an upsampled low-quality image. A small vector PDF can be excellent. Still, a surprisingly tiny TIFF or JPEG should prompt a closer look. It may have been aggressively compressed or exported at a smaller pixel size than intended.
A practical pre-upload checklist
Use a checklist before you upload, especially when a deadline is close. Stress makes people skip obvious checks. A structured pass catches the mistakes that journal portals love to flag.
- Read the journal instructions. Note required formats, minimum DPI, maximum file size, color mode, and naming rules.
- Confirm final print size. Decide whether each figure is single column, double column, or a custom size.
- Check pixel dimensions. Inspect width and height in pixels for every raster figure and panel.
- Calculate effective DPI. Divide pixels by print size in inches, then compare the result with the journal requirement.
- Inspect at 100 percent zoom. Check labels, scale bars, symbols, legends, and fine lines.
- Review compression. Look for blockiness, halos, fuzzy text, and damaged gradients.
- Open the exported file, not the working file. Problems often appear only after export.
- Test the upload copy. If the portal generates a PDF proof, inspect that proof carefully.
This is also the right moment to check consistency. Use the same font family across figures when the journal allows it. Keep label sizes readable after reduction. Make line weights thick enough for print. Resolution is not only about pixels. It supports legibility, and legibility supports your argument.
When you check figure resolution, do not forget supplementary files. Supplementary figures are often prepared later and with less care. They still represent your work. Poor supplementary images can irritate reviewers and confuse readers.
Common resolution mistakes and how to fix them
One common mistake is exporting from presentation software at screen resolution. Slide tools are convenient, but their default exports can be too small. If you must use them, set a larger slide size or export at a higher pixel scale. Then inspect the exported file.
Another mistake is taking screenshots of plots. Screenshots are usually limited by monitor resolution and can produce jagged text. Export directly from the plotting software instead. If the plot was made in R, Python, MATLAB, Prism, or Illustrator, you likely have a better export option than a screenshot.
A third mistake is assembling a figure in a document editor and then exporting the whole manuscript to PDF. This can downsample images without warning. Use dedicated figure design or layout tools, and submit separate figure files when the journal requests them.
Researchers also get caught by mismatched panels. A microscopy panel may be sharp, while a graph next to it is blurry. Or the full figure may meet 300 DPI, but an inset label was rasterized at low quality. Inspect the weakest component, not only the overall canvas.
Finally, avoid last-step enlargement. If a journal asks for 7 inch width and your figure was built at 4 inches, do not simply stretch it. Return to the editable source and rebuild or re-export at the correct size. This is slower, but it is the clean fix.
Final quality control before journal upload
Your final check should happen on the exact files you plan to submit. Close the editing software. Reopen each exported file in a viewer that will not hide problems. Confirm that the file name matches the journal's rules, then inspect size, format, pixel dimensions, and visual clarity.
If the journal portal creates a merged manuscript PDF, download it and inspect every figure. Portals sometimes flatten transparency, alter colors, or compress images. Pay close attention to small labels and multi-panel layouts. If something looks worse in the proof, fix the source file before completing submission.
It is worth being strict here. A clear figure helps reviewers evaluate your data without friction. A blurry figure makes them work harder and can make strong results feel less trustworthy. That is not fair to the work you already did.
To check figure resolution well, keep the workflow simple: know the final size, inspect pixel dimensions, calculate effective DPI, export from the source, avoid lossy compression, and review the final upload copy. Those steps will prevent most resolution-related rejections and make your manuscript look more polished from the first submission.
Frequently Asked Questions
What is the fastest way to check figure resolution before upload?
The fastest method is to inspect the image pixel dimensions, then divide them by the intended print size in inches. That gives you the effective DPI at final size. Compare that value with the journal's requirement for the figure type.
Can I check figure resolution by changing DPI in image software?
Not reliably. Changing DPI metadata without increasing real pixel dimensions only changes the suggested print size. To check figure resolution properly, confirm both the pixel dimensions and the final size the journal will print.
Is 300 DPI always enough for journal figures?
No. 300 DPI is often acceptable for photographs, microscopy images, and other continuous-tone images. Line art, graphs with small text, and mixed figures may need 600 DPI or higher, unless submitted as vector files.
Written by
Shobajo AbdulAzeez
Tags
Share this article