How to Prepare Multi-Panel Figures Without Losing Multi Panel Figure Resolution
In This Article
Understanding Multi Panel Figure Resolution Requirements
When preparing figures for scientific publication, maintaining proper multi panel figure resolution becomes your top priority. Publishers have strict requirements, and a single pixelated panel can derail your entire submission. Most journals require figures at 300 DPI or higher, with individual panels clearly readable at publication size.
The challenge multiplies when combining multiple data visualizations, microscopy images, and statistical plots into one cohesive figure. Each component may originate from different software with varying export capabilities. This creates a complex workflow where resolution loss can occur at multiple stages.
Resolution problems often stem from three common mistakes. First, researchers export individual panels at insufficient resolution before combining them. Second, they resize panels after assembly without maintaining aspect ratios. Third, they save the final figure in lossy formats like JPEG instead of high-quality alternatives.
Understanding your target publication's specific requirements prevents last-minute scrambling. Nature journals typically require 300 DPI for halftone images and 600-1200 DPI for line art. Cell Press publications have similar standards but may accept 200 DPI for certain figure types. Always check the author guidelines before starting your figure preparation.
Choosing the Right Tools and File Formats
Your software choice dramatically impacts the final quality of your multi-panel figures. Vector-based programs like Adobe Illustrator or Inkscape excel at maintaining crisp lines and text, even when scaled. They handle resolution independently for different elements within the same document.
However, raster-based images require careful handling. Photoshop works well for combining photographic elements but requires constant attention to resolution settings. Free alternatives like GIMP provide similar functionality with steeper learning curves.
File format selection proves equally critical. TIFF files preserve maximum quality for publication submission. PNG works well for web display while maintaining transparency. PDF format offers versatility for both print and digital use, especially when combining vector and raster elements.
Avoid JPEG for any intermediate steps in your workflow. Each time you save and reopen a JPEG, compression artifacts accumulate. Save JPEG only as a final web-ready copy, never as your master file.
Consider modern scientific design platforms that handle resolution automatically. When you create with Graffiy, the platform manages technical details while you focus on scientific storytelling. This approach eliminates many common resolution pitfalls that plague traditional workflows.
Planning Your Multi Panel Figure Layout
Effective planning prevents resolution disasters before they occur. Start by sketching your desired layout on paper or digital canvas. Consider how many panels you need and their relative importance. Main results deserve larger spaces and higher resolution allocation.
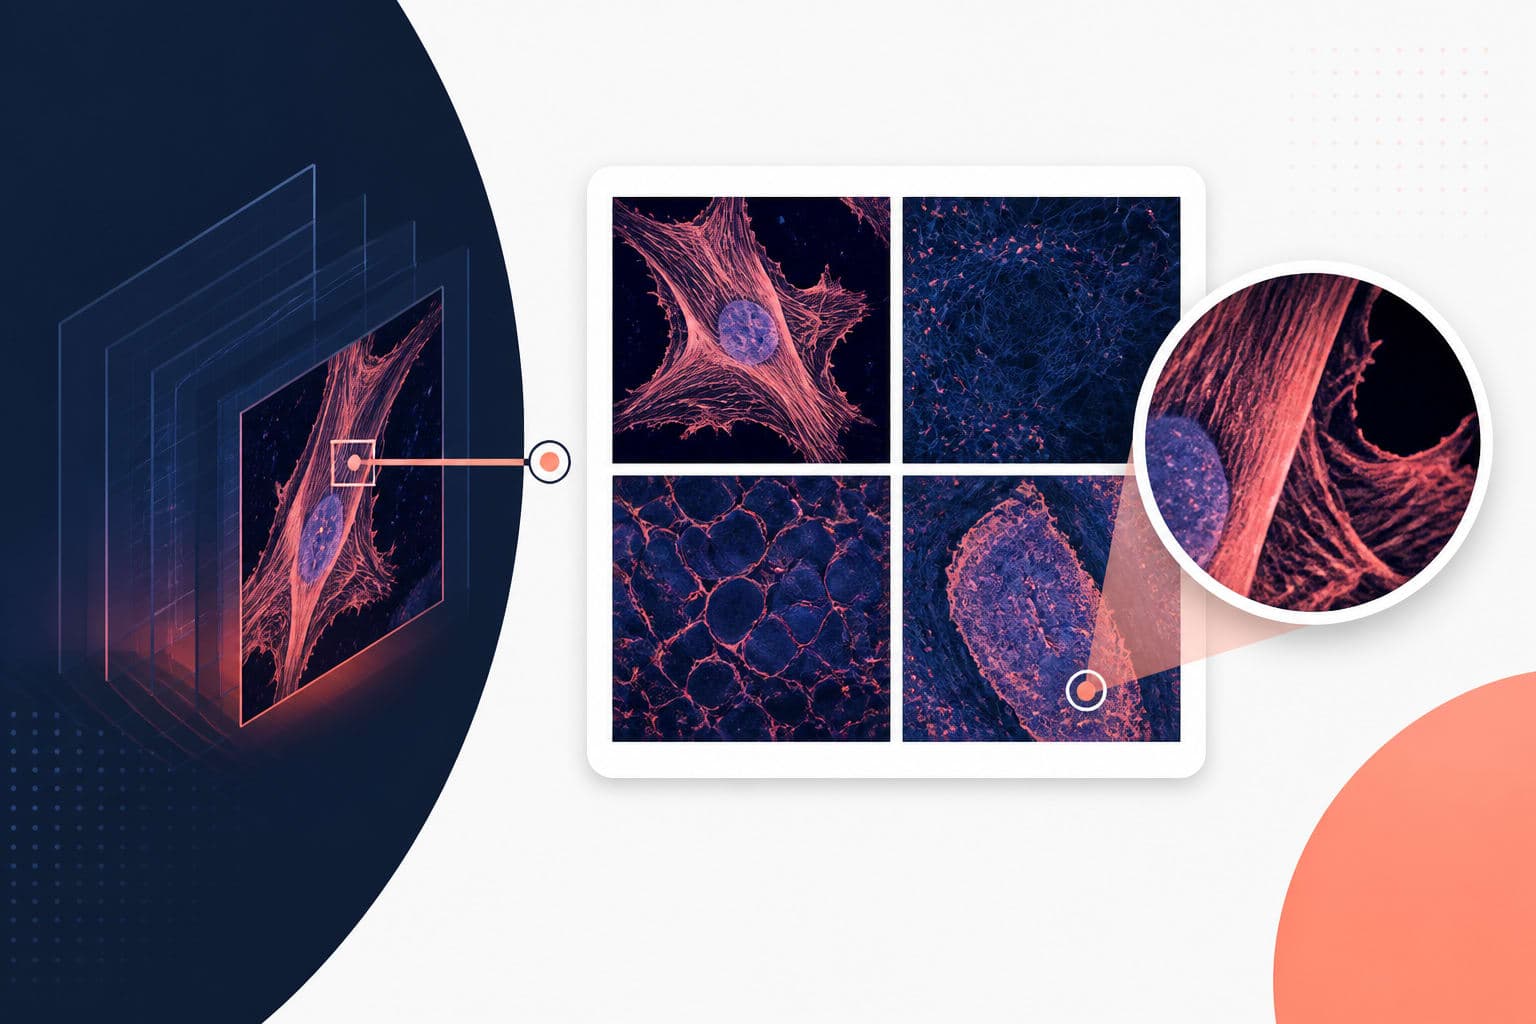
Calculate your final figure dimensions based on journal requirements. A typical full-width figure spans 7-8 inches in print journals. If you plan four equal panels in a 2x2 grid, each panel gets roughly 3.5 inches of width. At 300 DPI, this means each panel needs at least 1050 pixels width to avoid pixelation.

Plan consistent spacing between panels. White space improves readability and prevents visual clutter. Standard spacing ranges from 0.1 to 0.2 inches between panels, depending on your overall figure size and complexity.
Consider text size early in planning. Panel labels (A, B, C, etc.) should remain readable at final publication size. Axis labels, legends, and annotations must scale appropriately. Text smaller than 6-8 points becomes illegible in print.
Design with colorblind readers in mind. Use patterns or shapes alongside colors to convey information. This consideration affects your resolution needs since fine patterns require higher DPI to render clearly.
Optimizing Multi Panel Figure Resolution During Export
Export settings make or break your figure quality. Each software handles resolution differently, requiring specific approaches for optimal results. Start by setting your canvas or artboard to final dimensions with appropriate DPI before placing any elements.
When exporting from statistical software like R or Python, specify exact dimensions in inches rather than pixels. Use the following R example: ggsave(filename, width = 3.5, height = 2.5, units = "in", dpi = 300). This approach ensures consistent sizing across all panels.
Microscopy images often require special handling. Export original images at their native resolution, then resize proportionally in your figure assembly software. Never upscale low-resolution images, as interpolation creates artificial detail that reviewers will notice.
Vector graphics from software like Prism or Origin should export as PDF or SVG when possible. These formats scale infinitely without quality loss. If you must use raster formats, export at 600 DPI or higher to provide scaling flexibility during layout.
Adobe Illustrator users should enable "Use Artboards" when exporting. Set the artboard to your exact final dimensions and choose "High Quality Print" preset for PDF exports. This ensures consistent results across different viewing platforms.
For complex figures mixing vector and raster elements, export individual panels separately at high resolution. Assemble them in dedicated layout software rather than trying to manage everything in statistical plotting programs. This workflow provides maximum control over final quality.
Assembly Techniques for Professional Results
Professional figure assembly requires systematic approaches. Start with your highest-resolution elements and work downward. Place large panels first, then add smaller supporting graphics. This hierarchy prevents accidentally scaling down high-quality images.
Use alignment tools consistently. Most design software provides snap-to-grid or object alignment features. Enable these tools to create perfectly aligned panels with consistent spacing. Misaligned elements appear amateurish and distract from your scientific message.

Maintain consistent styling across all panels. Use identical fonts, line weights, and color schemes. Create style templates or use software styles to ensure consistency. This attention to detail distinguishes professional figures from hastily assembled composites.
Layer organization becomes crucial in complex figures. Name your layers descriptively ("Panel A - Western Blot", "Panel B - Bar Chart") rather than accepting default names. Group related elements together. This organization helps when making revisions or preparing alternative versions.
Preview your work at actual size regularly. Zoom to 100% view to check text readability and line clarity. What looks perfect at 25% zoom may reveal problems at full size. Many design programs offer print preview modes that simulate final output.
Testing and Quality Control
Quality control prevents embarrassing discoveries during peer review. Print test copies on high-quality paper to evaluate real-world appearance. Colors may shift between screen and print, especially for fluorescence microscopy images.
Test figure readability by showing printed copies to colleagues unfamiliar with your work. Can they understand each panel without extensive explanation? Are panel labels clearly visible? Do legends provide sufficient information?
According to guidelines published by the International Committee of Medical Journal Editors, figures should be self-explanatory and maintain quality across different viewing conditions. This standard emphasizes the importance of proper resolution throughout your workflow.
Create multiple export versions for different uses. Generate a high-resolution TIFF for print submission, a medium-resolution PDF for manuscript drafts, and a low-resolution PNG for presentations. Having multiple versions prevents the temptation to use inappropriate formats in wrong contexts.
Archive your source files with clear naming conventions. Include version numbers and creation dates in filenames. Store both the final assembled figure and individual panel source files. This organization proves invaluable when journals request modifications or alternative formats.
Common Mistakes and How to Avoid Them
Resolution problems often result from workflow shortcuts that seem harmless initially. Copying images directly from presentations into figure assembly software destroys quality. Presentations typically use 72-96 DPI images optimized for screen viewing, not print publication.
Avoid the temptation to fix resolution problems by increasing DPI settings without changing pixel dimensions. This creates artificially large file sizes without improving actual image quality. True resolution improvement requires starting with higher-quality source materials.
Never save works-in-progress as JPEG files. Each save-and-reopen cycle introduces compression artifacts. Use lossless formats like TIFF or PNG for intermediate files. Reserve JPEG only for final web-optimized versions.
Resist over-compressing final files to meet submission size limits. Most journals accept files up to 10-20 MB for figures. If your file exceeds limits, reduce dimensions slightly rather than increasing compression. Quality loss from excessive compression appears worse than slightly smaller figure dimensions.
Double-check font embedding in PDF exports. Missing fonts cause text to display incorrectly on different computers. Most professional software offers font embedding options in export dialogs. Enable these options to ensure consistent appearance across all viewing platforms.
Advanced Techniques for Complex Figures
Complex multi-panel figures benefit from advanced assembly techniques. Consider using master templates with predefined panel sizes and spacing. This approach ensures consistency across multiple figures in your manuscript.
For figures combining different data types, establish visual hierarchy through consistent sizing and positioning. Primary results get prominent placement and larger dimensions. Supporting data receives smaller, secondary positions. This hierarchy guides readers through your scientific narrative.
When including statistical significance indicators, ensure they scale appropriately with your panels. Asterisks and p-value annotations must remain readable at publication size. Consider using consistent symbol sizes across all statistical panels.
Multi-page figures require special consideration. Some journals accept multi-page figures for complex datasets. Plan page breaks logically, ensuring each page tells a complete story while contributing to the overall narrative.
Consider accessibility in your design choices. High contrast ratios help readers with visual impairments. Clear panel labels and consistent styling improve comprehension for all readers. These considerations often align with resolution requirements, creating figures that work well both technically and scientifically.
Final Export and Submission Preparation
Final export requires methodical attention to detail. Create a submission checklist covering file format, resolution, dimensions, and naming conventions. Different journals have varying requirements, making checklists essential for avoiding rejection due to technical issues.
Generate required file formats systematically. Start with your highest-quality master file, then create derivatives for different submission requirements. This workflow prevents accidentally submitting low-quality versions.
Validate your final files before submission. Open exported files in different software to ensure compatibility. Check file sizes against journal limits. Verify that all text remains readable and all images display correctly.
Include detailed figure legends that describe each panel clearly. Good legends reduce the burden on figure quality by providing context that pure visual elements cannot convey. However, never rely on legends to compensate for poor image quality.
Keep detailed records of your figure preparation workflow. Document software versions, export settings, and file formats used. This information helps when journals request modifications or when preparing similar figures for future publications.
The investment in proper multi panel figure resolution pays dividends throughout the publication process. Reviewers notice quality immediately, and high-resolution figures enhance the perceived quality of your entire manuscript. With systematic approaches and attention to technical details, you can create figures that effectively communicate your scientific discoveries while meeting the highest publication standards.
Frequently Asked Questions
What DPI should I use for multi panel figure resolution in journal submissions?
Most journals require 300 DPI for photographic images and 600-1200 DPI for line art. Always check your target journal's specific author guidelines, as requirements vary between publishers.
Can I fix low-resolution panels by increasing DPI settings after export?
No, artificially increasing DPI without changing pixel dimensions doesn't improve actual image quality. You must start with high-resolution source materials and export at appropriate settings from the beginning.
What file format should I use for saving multi-panel figures during preparation?
Use TIFF or PNG for intermediate files to preserve quality. Save JPEG only as final web-ready copies, never as working files, since JPEG compression degrades quality with each save cycle.
Written by
Shobajo AbdulAzeez
Tags
Share this article