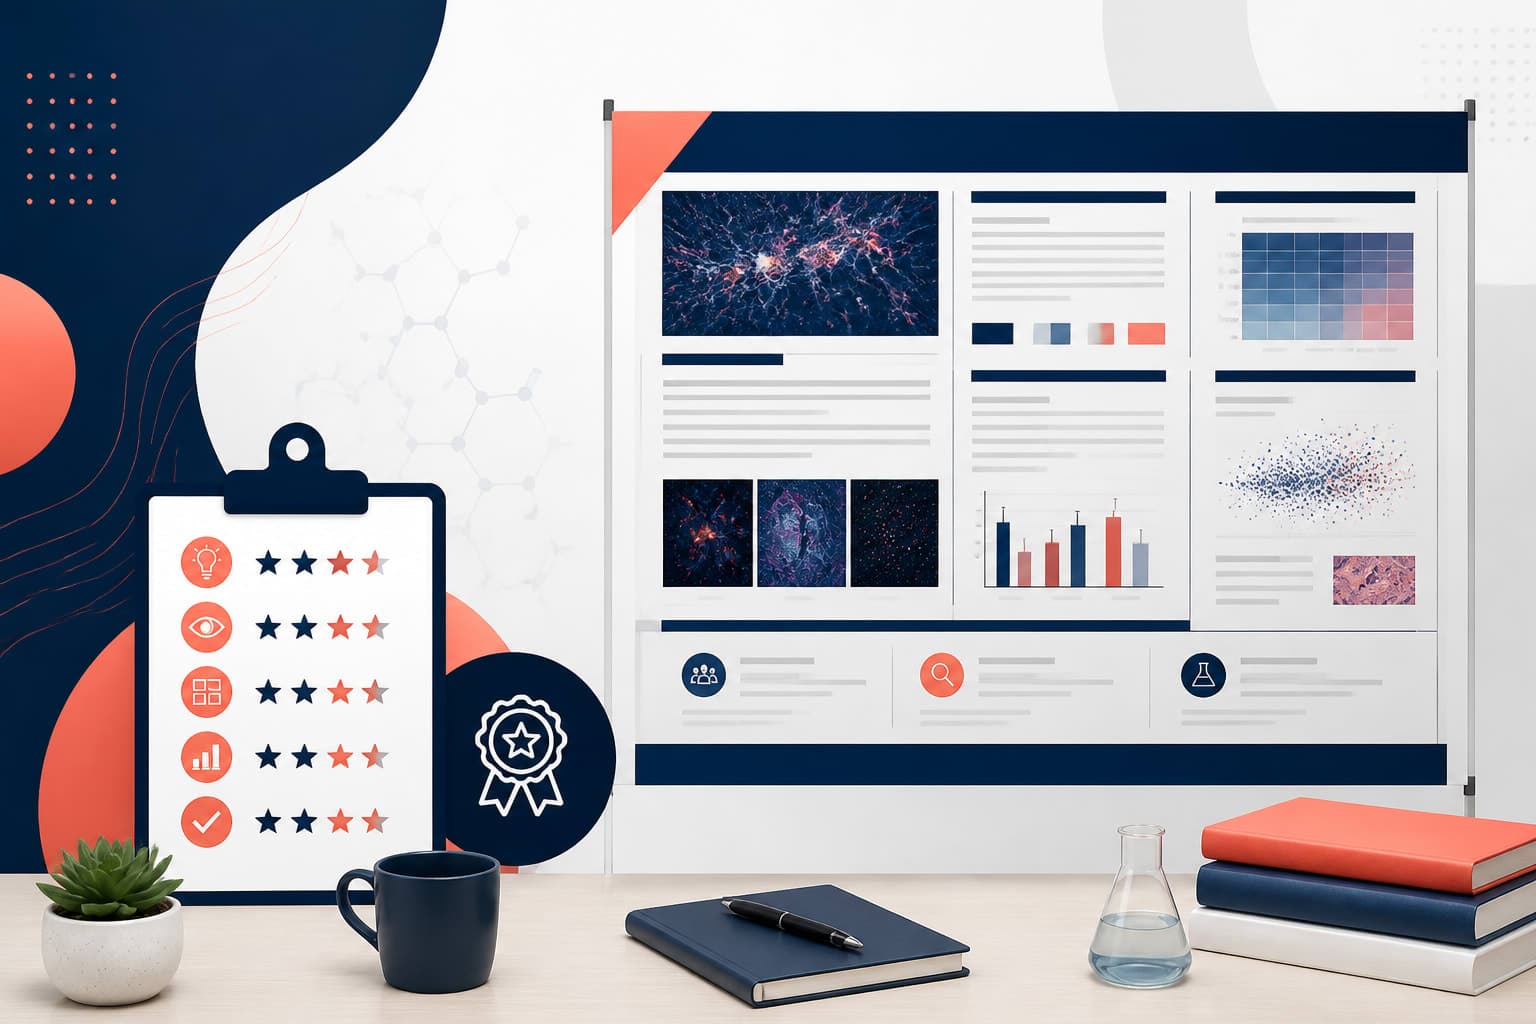
Conference Poster Tips: Why Your Poster Isn't Getting Attention and How to Fix It
In This Article
Why good research gets ignored
Conference poster tips often focus on polish, but attention problems usually start earlier. Your poster may contain strong research, careful analysis, and a useful conclusion, yet still lose people in the aisle. The problem is rarely the science. More often, attendees cannot tell what matters in the first five seconds.
A conference poster competes with noise, movement, coffee, schedules, and dozens of other posters. Graduate students and early-career researchers often treat the poster like a compressed manuscript. That instinct is understandable, but it creates a wall of text, tiny figures, and labels that only make sense to people already inside the project.
The fix is not decoration. The fix is making the science easier to enter. A strong poster gives strangers a clear path: what question you asked, what you found, why it matters, and what they should ask you next.
Conference poster tips for the first five seconds
Most poster visitors do not begin by reading. They scan. They look at the title, the biggest visual, a few headings, and maybe your conclusion. If that quick scan feels promising, they slow down. If it feels like work, they keep walking.
Your poster needs a visible entry point. The title should state the finding or question, not just the topic. A central figure should be readable from a step back. Headings should guide the story, not merely copy manuscript sections.
Try this practical test. Stand two meters away from your poster, or shrink it on your screen to postcard size. Ask what a tired attendee can understand in five seconds. If the answer is only your field, not your claim, the hierarchy is too weak.
Another useful test is to cover everything except the title, headings, figures, and conclusion. Can someone still understand the main message? If not, your poster depends too much on paragraph text.
Problem 1: Too much text
The most common poster problem is text overload. You worked hard on the project, so every detail feels important. Methods, caveats, subgroup analyses, citations, and background all compete for space. The result looks thorough, but it asks too much from a passerby.
A poster is not a paper mounted on a board. It is a conversation starter. Your job is to make someone interested enough to ask a question. You can explain secondary details when they stop.
Before: the compressed manuscript
Before: the introduction is 220 words, the methods section is a dense paragraph, and the results are described twice, once in text and once in a figure. The conclusion says, More research is needed, which is true but forgettable.
After: the introduction becomes three bullets: the problem, the gap, and the study question. The methods section becomes a compact workflow. The results text becomes one sentence above the main figure: Intervention sites showed a 32 percent higher follow-up rate than control sites after adjustment.
This is not dumbing down. It is removing duplication. If a figure already shows the main result, do not repeat every number in a paragraph. Use the text to interpret the figure.
- Replace background paragraphs with a two or three bullet rationale.
- Turn methods into a diagram, timeline, or labeled workflow.
- Put one main message near each figure.
- Move extra citations to a small references area or QR code.
- Use your conversation, not the poster, for nuance.
Problem 2: Weak visual hierarchy
Hierarchy tells the reader where to look. Without it, the poster becomes a flat grid of equal boxes. Viewers cannot tell whether the main contribution is the title, the methods, the microscopy image, the p value table, or the acknowledgments.
Weak hierarchy often comes from good intentions. You want balance. You want collaborators represented. You want every section to look neat. But a poster is not a spreadsheet. It needs visual priority.
Start by choosing one primary message. If someone remembers only one thing, what should it be? Put that message in the title, subtitle, or conclusion, and support it with the largest visual element on the poster.
Then create three reading levels. Level one is the title and main visual. Level two is headings and key result statements. Level three is supporting detail. This gives visitors options. They can scan quickly, read selectively, or stop and discuss.
Before and after hierarchy example
| Poster element | Before | After |
|---|---|---|
| Title | General topic title with acronyms | Finding-led title with the main variable and outcome |
| Figures | Four similar-sized plots | One large primary figure, two small supporting figures |
| Headings | Introduction, Methods, Results, Discussion | Question, What we did, What changed, Why it matters |
| Conclusion | Small paragraph at bottom right | Three bold takeaways near the main result |
Notice the after version does not remove rigor. It organizes rigor. The viewer sees the main claim first, then can check the methods and supporting data. That sequence feels respectful, not simplistic.
One of our strongest conference poster tips is to design around the conversation you want. If your goal is collaboration, make the unanswered question visible. If your goal is feedback, show the fragile assumption.
If you want to speed up this process, you can create with Graffiy and turn your research story into a cleaner scientific visual structure. AI-assisted layout is not a substitute for judgment, but it can help you get past the blank canvas faster.
Problem 3: Tiny fonts that punish readers
Tiny type is a silent poster killer. You may not notice it on a large monitor, especially while zoomed in. At a conference, people read while standing, carrying bags, and looking over shoulders. If they need to lean in for every label, they will leave.
Font size depends on poster dimensions and viewing distance, but the principle is simple. Important text should be readable from several feet away. Body text should not feel like fine print. Axis labels, legends, and captions deserve particular attention because they often shrink during export.
As a rough guide, use a title around 72 to 110 points, headings around 40 to 60 points, body text around 28 to 36 points, and figure labels around 24 to 32 points. These are starting points, not laws. Print size, conference rules, and typeface choice matter.
The biggest mistake is making body text barely acceptable, then allowing figure labels to become even smaller. Your data visualizations are not decorative. If the labels are unreadable, the evidence is unreadable.
Before and after font example
Before: a results plot has nine colored lines, a 10 point legend, crowded x-axis labels, and a caption that explains everything. The plot contains the right data, but no one can read it from standing distance.
After: the plot shows the three most important groups, labels the lines directly, removes the legend, increases axis text, and adds a short title above the chart: Follow-up improved most in rural clinics.

Problem 4: Poor color choices
Color can guide attention, separate groups, and make a poster feel polished. It can also create confusion quickly. Common problems include low contrast, too many colors, red-green comparisons, and decorative backgrounds that fight the data.
Use color with a job description. One color can highlight the main condition. A second can mark comparison groups. Neutral grays can hold background information. If every section uses a new color, viewers must keep decoding your design instead of understanding your research.
Contrast matters for accessibility and basic readability. The W3C explains contrast requirements for readable text in its guidance on minimum contrast. Posters are not websites, but the principle carries over. Pale gray text on white may look elegant on your laptop and disappear under conference lighting.
Be careful with saturated backgrounds. A dark navy title bar can work. A full poster background in bright blue usually makes text harder to read. White or very light backgrounds remain popular because they keep figures clean and printing predictable.
Before and after color example
Before: the poster uses a blue gradient background, red headings, green bars, purple callouts, and yellow highlights. The colors are energetic, but they compete. The reader cannot tell which color carries meaning.
After: the poster uses a white background, charcoal text, one deep blue accent for headings, and one orange highlight for the key result. Group comparisons use a colorblind-aware palette, and labels are direct. The result feels calmer and more scientific.
Color should never be the only way to encode meaning. Pair color with labels, shapes, line styles, or direct annotations. This helps readers with color vision differences and helps everyone reading quickly.
A simple poster repair workflow
If your poster already exists and feels messy, do not start by changing fonts. Start with content decisions. Design improves quickly when the message is clear.
- Write the one-sentence claim. State the main finding or question in plain language.
- Choose the hero visual. Pick the figure, image, diagram, or model that best supports the claim.
- Cut repeated text. Delete any sentence that simply restates a visible figure.
- Rename headings. Use headings that explain, not just categorize.
- Increase type size. Make body text and figure labels readable at distance.
- Limit the palette. Use one primary accent color and one highlight color.
- Test from far away. View the poster small, then print a section at actual size.
This order matters. If you polish a crowded poster, you get a prettier crowded poster. If you clarify the story first, layout choices become easier.

Before and after: a full poster diagnosis
Imagine a graduate student presenting a study on microbial diversity after soil restoration. The original title is Assessment of Microbial Community Dynamics in Restored Agricultural Sites. It sounds formal, but it does not tell us what changed.
The poster has a long literature review, three ordination plots, two tables, a map, and a methods paragraph with sequencing details. Everything is arranged in equal columns. The conclusion says restoration may influence microbial communities.
Here is the repair. The title becomes Restored fields show higher microbial diversity within two growing seasons. The main figure becomes a large diversity plot with direct labels. The ordination plots move smaller and support the main story. The methods become a compact workflow: sites, sampling, sequencing, analysis.
The color palette changes from five bright colors to earth tones with one strong accent. Body text drops from 1,100 words to 520 words. The conclusion becomes three takeaways: restored sites increased alpha diversity, community composition shifted toward reference fields, and soil moisture explained the strongest variation.
This after version gives viewers something to react to. A soil scientist might ask about seasonality. A statistician might ask about model structure. A land manager might ask what restoration practice mattered most. That is a successful poster outcome.
Final conference poster tips before you print
Before you send the final file, run one last pass with fresh eyes. Better yet, ask someone outside your project to explain the poster back to you. Do not defend it while they talk. Listen for confusion.
Check the export too. Open the final PDF at 100 percent. Zoom into figures. Confirm that symbols, Greek letters, equations, and special characters survived. Make sure QR codes work. Check that the poster size matches the conference instructions.
Also prepare your verbal summary. A clear poster helps, but your explanation still matters. Practice a 20-second version, a two-minute version, and a longer version for specialists. This keeps you from reading the poster aloud, which almost nobody enjoys.
The best conference poster tips are not about making your work flashy. They are about reducing friction. Give people a clear title, a readable main result, generous type, purposeful color, and enough white space to think. Your research deserves that much care, and your future conversations will be better for it.
Frequently Asked Questions
What are the most important conference poster tips for first-time presenters?
Start with one clear message, then build the poster around it. Use a finding-led title, one dominant visual, readable fonts, and short text blocks. Your goal is to invite a conversation, not reproduce your full paper.
How much text should a research conference poster have?
Most posters work best with about 300 to 700 words, although technical fields may need more. If your poster has long paragraphs, try turning methods into a workflow and results into annotated figures. Keep detailed explanations for your spoken discussion or a linked handout.
What font size should I use on a conference poster?
A practical starting point is 72 to 110 points for the title, 40 to 60 points for headings, and 28 to 36 points for body text. Figure labels should often be 24 points or larger. Always test at actual size because export settings and typefaces can change readability.
Written by
Shobajo AbdulAzeez
Tags
Share this article