How to Make Accessible Scientific Figures That Reach Every Audience
In This Article
Why Accessible Scientific Figures Matter
When you publish research, your scientific figures should communicate findings to everyone, regardless of visual abilities or assistive technology needs. Yet many researchers overlook accessibility, inadvertently excluding readers who could benefit from their work. Creating accessible scientific figures isn't just about compliance or good intentions. It's about maximizing your research impact and ensuring scientific knowledge reaches its full potential audience.
Consider this: approximately 15% of the global population lives with some form of disability, and visual impairments affect millions of researchers, students, and professionals worldwide. When your figures lack proper contrast, descriptive labels, or alternative text, you're essentially publishing incomplete information for a significant portion of your audience.

Moreover, accessible design benefits everyone, not just those with disabilities. Clear labels, high contrast, and logical organization make figures easier to understand for all readers, whether they're viewing on mobile devices, printing in black and white, or quickly scanning through research papers.
Essential Elements of Accessible Scientific Figures
Creating truly accessible figures requires attention to several key elements. Each component works together to ensure your visual data tells a complete story that everyone can understand and interpret accurately.
The foundation of accessibility starts with thoughtful design choices. This means considering how information is presented visually and ensuring multiple pathways exist for readers to access that information. Let's examine the core components that transform standard figures into accessible ones.
Alternative Text That Tells the Story
Alternative text serves as the bridge between visual information and screen readers. However, writing effective alt text for scientific figures requires more nuance than describing a simple photograph. Your alt text should convey the figure's purpose, key findings, and essential data patterns.
Start with the figure type and main message. For example: "Bar chart showing protein expression levels increased by 300% in treated samples compared to controls." Then provide essential details about trends, comparisons, or notable data points that support your research conclusions.
Avoid simply listing every data point. Instead, focus on what the figure demonstrates or proves. A good alt text reads like a concise summary of the figure's contribution to your research narrative. Consider what you would tell a colleague over the phone to explain the figure's significance.
Color and Contrast Considerations
Color alone should never be the sole method for conveying critical information in your figures. While color can enhance understanding and visual appeal, approximately 8% of men and 0.5% of women have some form of color vision deficiency. This means millions of researchers and readers may struggle to distinguish between colors you consider obviously different.
High contrast ratios ensure text and important elements remain readable for users with low vision or when viewing conditions are suboptimal. Aim for a contrast ratio of at least 4.5:1 for normal text and 3:1 for large text. Many online tools can help you check contrast ratios during the design process.
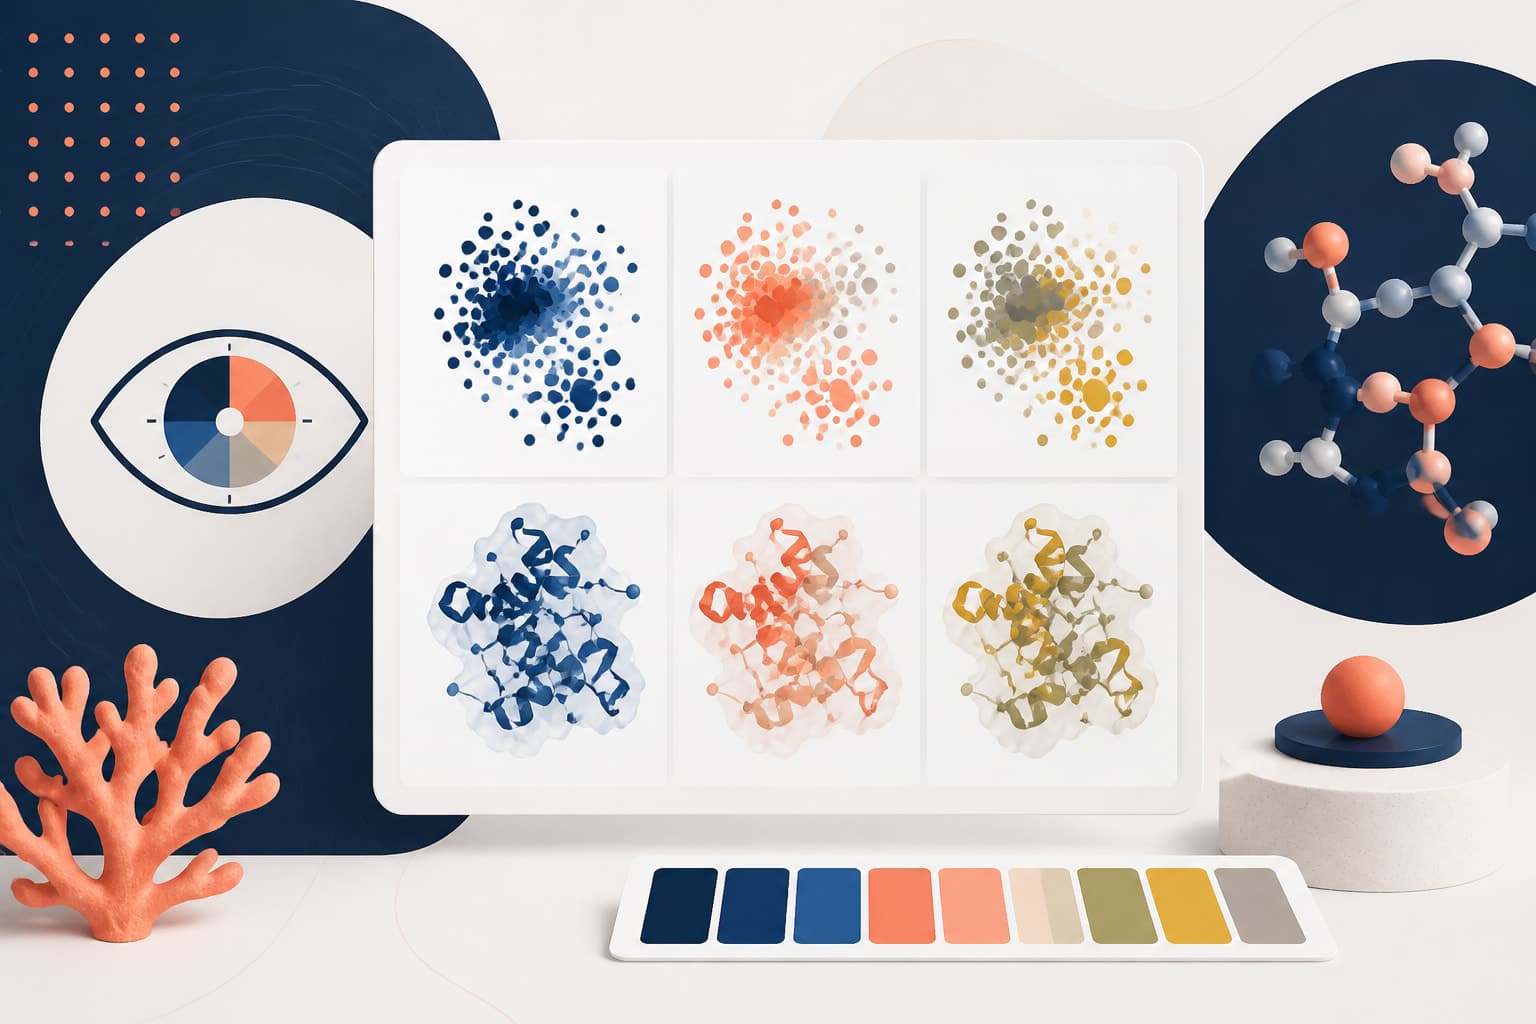
When using color to represent different data categories, supplement with patterns, shapes, or symbols. Hatching patterns, different line styles, or distinct markers can convey the same categorical information without relying solely on color perception.
Implementing Visual Cues Beyond Color
Effective scientific communication uses multiple visual channels to reinforce important information. This redundancy ensures that if one pathway is inaccessible to a reader, alternative pathways remain available to convey the same essential data.
Pattern and texture provide excellent alternatives to color-only coding. In bar charts, use different fill patterns like diagonal lines, dots, or crosshatching. For line graphs, vary line styles with solid, dashed, or dotted patterns. Scatter plots benefit from different marker shapes like circles, squares, triangles, or diamonds.
Size and position also communicate hierarchy and importance. Larger elements naturally draw attention, while strategic positioning guides the eye through your data story. Bold fonts can emphasize critical labels or values without relying on color changes.
Consider adding direct labels to data points or series when space allows. This reduces cognitive load and eliminates the need for readers to constantly reference legends or color keys. Direct labeling particularly benefits complex multi-series charts where color alone might create confusion.
Typography and Label Design
Clear, readable typography forms the backbone of accessible figure design. Choose fonts with good character distinction and avoid decorative typefaces that may be difficult to read, especially at smaller sizes. Sans-serif fonts typically perform better than serif fonts in digital contexts and scientific figures.
Font size matters more than you might think. While space constraints often pressure researchers to use tiny text, illegible labels defeat the purpose of the entire figure. Aim for minimum font sizes of 12 points for most text, with smaller sizes only for supplementary information that isn't critical to understanding.
Label placement requires strategic thinking. Position labels close to relevant data elements to minimize the visual distance readers must travel. Avoid overlapping text or placing labels over busy background patterns that might reduce readability.
Technical Implementation Strategies
Putting accessibility principles into practice requires understanding both the tools at your disposal and the technical considerations that ensure your figures work across different platforms and assistive technologies.
Most scientific visualization software now includes accessibility features, though they may not be enabled by default. Research the accessibility options in your preferred tools, whether that's R, Python's matplotlib, Adobe Illustrator, or specialized scientific graphing applications.
When you create with Graffiy, accessibility features are built into the platform, making it easier to implement these best practices without extensive technical knowledge. However, regardless of your chosen tool, understanding the principles ensures you can adapt to any workflow.

File Formats and Compatibility
Your choice of file format can impact accessibility. Vector formats like SVG maintain crispness at any zoom level, which benefits users who need to magnify content. Additionally, SVG files can embed structured information that screen readers can interpret more effectively than raster images.
PDF figures with proper tagging allow screen readers to access embedded text and structural information. However, many researchers export figures as simple images embedded in PDFs, losing this accessibility advantage. When possible, use tools that maintain figure structure and text information in the final output.
Consider providing multiple format options when publishing. While journals may require specific formats, supplementary materials can include more accessible versions. Some researchers provide both standard figures and high-contrast alternatives as supplementary files.
Testing and Validation
Creating accessible figures requires testing with real users and assistive technologies. However, you can perform initial validation using several straightforward methods before involving accessibility experts or users with disabilities.
Color vision simulators help you see how your figures appear to people with different types of color vision deficiency. Many online tools and browser extensions can simulate various conditions, allowing you to identify potential issues early in the design process.
Screen reader testing provides valuable insights into how assistive technology interprets your figures. Even without specialized software, you can use built-in accessibility tools on most operating systems to understand how your alt text and figure structure translate to audio descriptions.
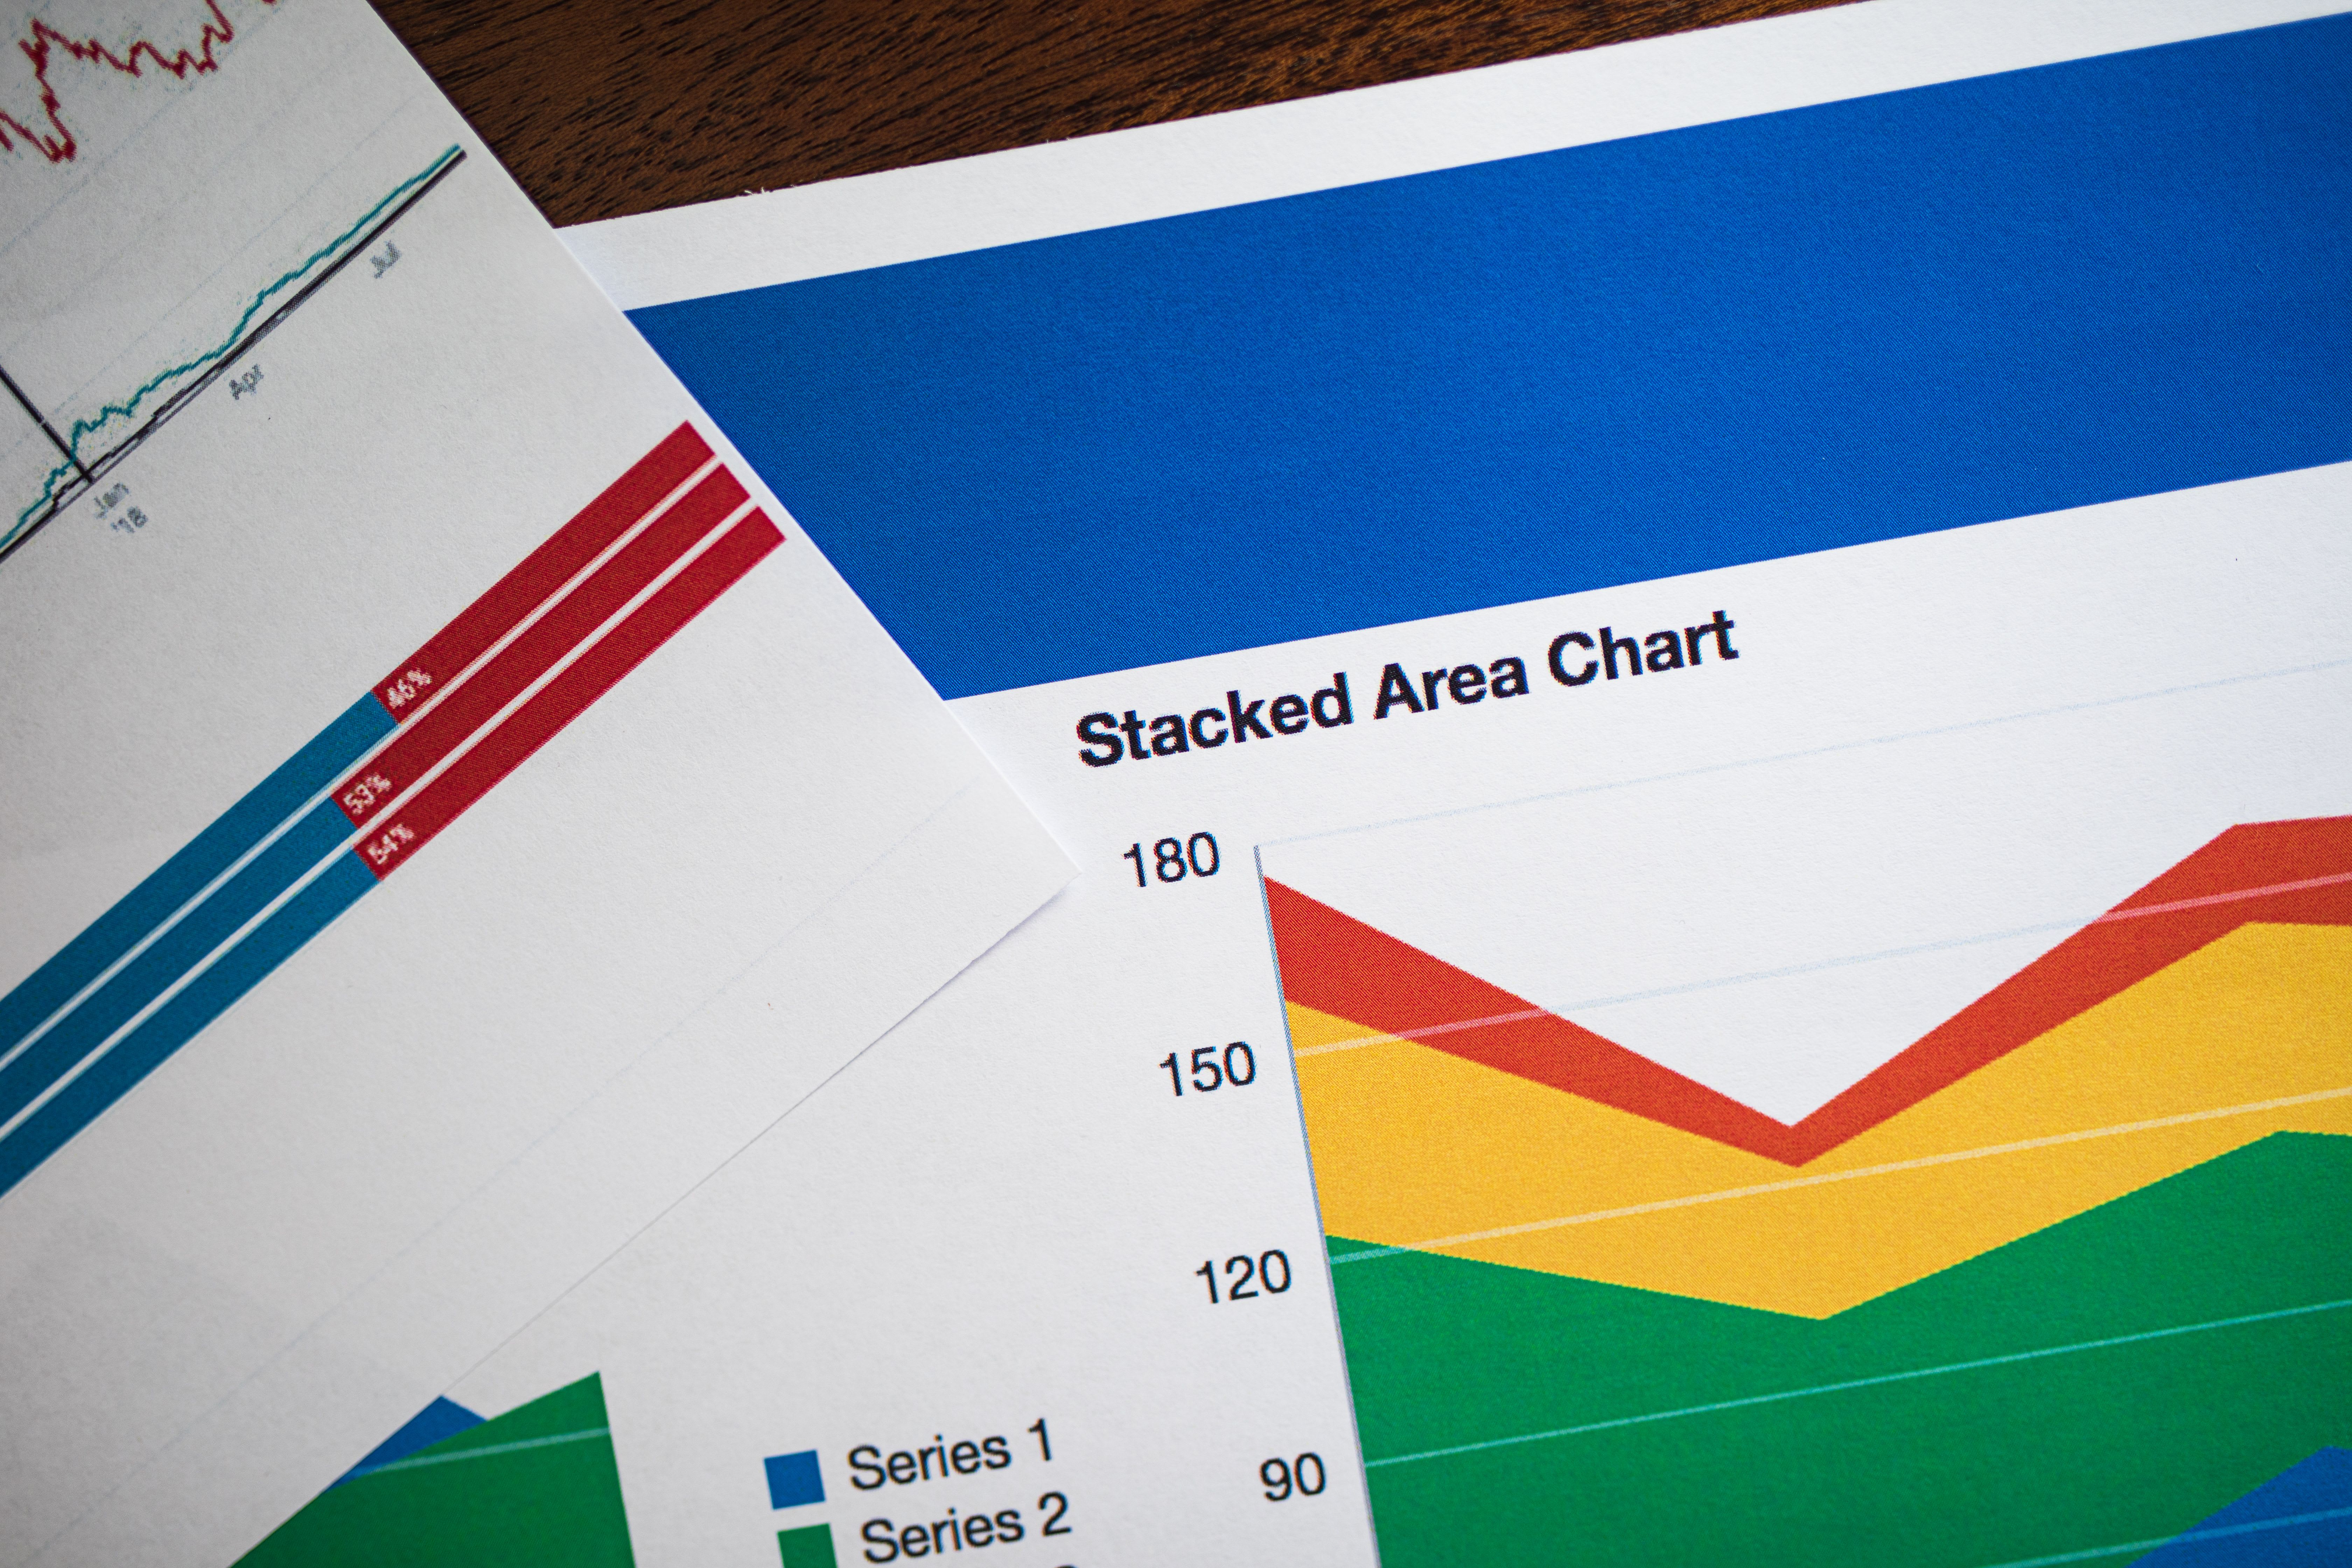
Print your figures in grayscale to evaluate whether important information remains clear without color. This simple test reveals whether you've relied too heavily on color to convey critical data relationships.
Common Mistakes and How to Avoid Them
Even well-intentioned researchers often make predictable mistakes when first implementing accessibility practices. Understanding these common pitfalls can save time and ensure your efforts create genuinely accessible content.
One frequent error involves writing alt text that simply repeats the figure caption. Alt text and captions serve different purposes. Captions provide context within the document flow, while alt text describes visual content for those who cannot see it. Your alt text should focus on the visual elements and data patterns, complementing rather than duplicating the caption.
Another common mistake is inconsistent accessibility implementation across a publication. If some figures include proper alt text and high contrast while others don't, you've created an uneven user experience. Develop a consistent approach and apply it systematically to all visual elements in your work.
Over-reliance on Color
The most prevalent accessibility mistake in scientific figures is using color as the primary or only method to distinguish between data categories. This creates immediate barriers for readers with color vision differences and problems when figures are printed or viewed on monochrome displays.
Red and green combinations cause particular difficulties, as these colors are most commonly confused in color vision deficiency. However, the solution isn't simply avoiding these colors. Instead, supplement any color coding with additional visual cues like patterns, shapes, or direct labeling.
Consider the broader context of your color choices. While individual colors might have sufficient contrast, combinations within the same figure might create confusion. Test your entire color palette together, not just individual elements in isolation.
Inadequate Contrast and Size
Subtle color differences and small font sizes create barriers for readers with various visual needs. What appears clear on your high-resolution monitor might become illegible on different devices or for users with low vision.
Establish minimum standards for your work and stick to them consistently. Use contrast checking tools during design rather than hoping issues won't arise later. Building these checks into your workflow prevents problems rather than requiring fixes after publication.
Remember that contrast requirements extend beyond text. Data visualization elements like bars, lines, and markers also need sufficient contrast against their backgrounds to remain distinguishable for all users.
Tools and Resources for Better Accessibility
Creating accessible figures becomes significantly easier with the right tools and resources. Many free and paid options can help you implement accessibility best practices without extensive technical expertise.
Web-based contrast checkers like the WebAIM Contrast Checker allow you to test color combinations quickly during the design process. These tools provide immediate feedback on whether your choices meet accessibility standards and suggest improvements when needed.
Color vision simulation tools help you understand how your figures appear to users with different types of color perception. Browser extensions and online simulators can show you exactly what readers with protanopia, deuteranopia, or tritanopia experience when viewing your work.
Many scientific software packages now include built-in accessibility features. R packages like ggplot2 offer colorblind-friendly palettes, while Python's matplotlib includes accessibility-focused themes and options. Learning to use these features can dramatically improve your figure accessibility with minimal additional effort.
Professional Development and Training
Understanding accessibility principles requires ongoing learning and practice. Several organizations offer training specifically focused on accessible scientific communication and data visualization.
Professional development in accessibility often pays dividends beyond individual figure creation. As more institutions and journals adopt accessibility requirements, researchers with these skills find themselves better positioned to meet evolving standards and reach broader audiences.
Consider accessibility as part of your broader scientific communication toolkit. The principles that make figures accessible often improve clarity and impact for all readers, making this knowledge valuable regardless of specific accessibility requirements.
Building accessibility awareness within your research group or institution creates lasting benefits. When entire teams understand and implement these practices, accessibility becomes a natural part of the research communication process rather than an afterthought or compliance requirement.
Frequently Asked Questions
What makes scientific figures truly accessible to all readers?
Accessible scientific figures combine multiple elements: descriptive alt text that explains key findings, high contrast ratios for visibility, non-color visual cues like patterns or shapes, and clear labeling. These features ensure that readers with various visual abilities can understand and interpret your research data effectively.
How do I write effective alt text for complex scientific graphs?
Focus on the figure's main message and key findings rather than describing every visual element. Start with the graph type and primary conclusion, then highlight important trends, comparisons, or data patterns. Your alt text should convey what the figure proves or demonstrates in your research narrative.
Can I still use color in my figures while maintaining accessibility?
Absolutely! Color enhances figure appeal and can aid comprehension when used properly. The key is never relying on color alone to convey critical information. Always supplement color coding with patterns, shapes, direct labels, or other visual cues that provide the same information through alternative channels.
Written by
Shobajo AbdulAzeez
Tags
Share this article