Color Alone Accessibility Figures: Accessibility Rules for Research Visuals
In This Article
Why color alone accessibility figures matter
Color alone accessibility figures are one of the most common, and most avoidable, problems in research communication. If your scatter plot uses red dots for one group and green dots for another, color is doing all the work. That means some readers will miss the comparison, misread the data, or need extra effort to understand what you intended.
Accessibility is not a decorative checklist. It is part of scientific accuracy. A figure that depends only on hue may look polished on your screen, yet fail in a printed handout, a lecture slide, a grayscale photocopy, or a journal PDF viewed under poor lighting. The rule is simple: never make color the only signal for meaning.

This guide is for researchers and educators who make charts, diagrams, posters, slides, and teaching materials. We will focus on practical fixes: shape, pattern, direct labels, line style, text cues, and clear legends. You do not need to remove color. You need to stop asking color to carry meaning alone.
The rule: color can support meaning, not own it
The accessibility rule is easy to remember: color may reinforce information, but it should not be the only way to perceive it. This idea appears in the Web Content Accessibility Guidelines. The W3C guidance on use of color in WCAG explains that color cannot be the sole visual means of conveying information, indicating an action, prompting a response, or distinguishing a visual element.
Research visuals have special stakes. A mislabeled treatment group, an invisible threshold, or a confusing map key can change how readers interpret evidence. If a figure is inaccessible, it is not just less inclusive. It is less reliable as a communication tool.
Good color alone accessibility figures practice does not mean every chart becomes black and white. Color is useful. It can group categories, show intensity, guide attention, and make complex data feel readable. The problem starts when the figure collapses without color.
Try this quick test. Imagine your visual printed in grayscale. Then imagine it projected in a bright classroom. Then imagine it viewed by someone with red green color vision deficiency. If the main message still works, you are on solid ground. If not, add another cue.
Who is affected when figures rely only on color?
Color vision deficiency is common, but it is not the only reason color can fail. Some readers cannot distinguish certain hues. Others view your work on low quality screens, through compressed PDFs, or in printed course packets. Students may photograph slides from the back of a room. Journal reviewers may read at night using reduced screen brightness.
In teaching, color only cues can create unnecessary barriers. A student may understand the concept but miss the category distinction. In research, the cost can be higher. A reviewer may misinterpret your graph. A clinician may overlook a risk band. A policy audience may miss a boundary on a map.
Accessibility also helps people who are not disabled. When you add labels, patterns, and shapes, you reduce cognitive load for everyone. Readers spend less time decoding the legend and more time understanding your point. That is good design, not extra work.
Color alone accessibility figures are especially risky in dense visuals. Heatmaps, survival curves, microscopy panels, flow diagrams, anatomical maps, and multi series line charts often use color as shorthand. The more complex the visual, the more valuable redundant cues become.
Pair color with shape, pattern, and text cues
The best solution is redundancy. Use two or more visual cues to express the same distinction. Color can still be one cue, but shape, pattern, line style, position, and text should support it. This makes the figure resilient across screens, print formats, and reader needs.
Use shape for categories
Shape is excellent for categorical data. In scatter plots, use circles, triangles, squares, diamonds, and crosses. In diagrams, use different node shapes for different entity types. In maps, use distinct icons for site types. Avoid tiny shape differences that disappear at small sizes.
A strong pairing might be blue circles for controls and orange triangles for treatment. If the image becomes grayscale, the groups still differ. If the shapes are large enough, the distinction remains visible in slides and printed articles.
Use pattern for fills and regions
Pattern works well for bars, map regions, confidence zones, and schematic areas. Stripes, dots, crosshatching, and diagonal fills can distinguish groups when colors look similar. Keep patterns simple. Dense patterns can create visual noise, especially in small bars or crowded maps.
Patterns are particularly helpful when journals charge for color printing or when educators distribute black and white materials. If your figure still makes sense without color, you have lowered the risk of misinterpretation.
Use text labels near the data
Legends are useful, but direct labels are often better. Put the group name next to the line, cluster, bar, or region when space allows. This reduces eye travel between the legend and the data. It also helps readers who cannot easily match color swatches to plotted elements.
For line charts, label each line near its endpoint. For anatomical diagrams, label regions directly. For microscopy images, add text callouts and arrows, not just colored outlines. Direct labels make color alone accessibility figures far easier to understand.
Use line style and marker style together
For line charts, combine color with solid, dashed, dotted, or dash dotted lines. Add distinct markers at key points when the chart is not too crowded. A blue solid line and an orange dashed line remain distinguishable when printed in grayscale.
Be careful with too many line styles. Four or fewer series are usually manageable. If you have six or more series, consider small multiples, faceting, or grouping related lines into separate panels. Accessibility sometimes means changing the chart type, not adding more decoration.
Practical rules for common research visuals
Different figure types need different solutions. Use the table below as a practical starting point when reviewing your next manuscript, poster, or lecture deck.
| Visual type | Risk when using color alone | Better cue pairing |
|---|---|---|
| Scatter plot | Groups merge for readers who cannot distinguish hues | Color plus marker shape, direct labels, and clear legend text |
| Line chart | Series become indistinguishable in grayscale | Color plus line style, endpoint labels, and markers |
| Bar chart | Conditions look identical after printing | Color plus pattern fills and labels on or near bars |
| Heatmap | Magnitude depends on subtle hue differences | Colorblind safe palette, numeric labels, clear scale, and grouping lines |
| Map | Regions or risk levels blur together | Color plus texture, boundary labels, icons, and explanatory legend text |
| Microscopy figure | Channels or annotations become unclear | Color plus channel labels, arrows, outlines, and panel captions |
For scatter plots, do not use five shades of the same hue unless the variable is ordered and the scale is clear. For categories, pick distinct marker shapes. Increase marker size slightly for presentation slides. Add labels to major clusters when possible.
For bar charts, patterns are your friend. Use them sparingly and consistently. A dotted fill should mean the same condition across all panels. If each panel changes the pattern system, readers have to relearn your visual language.
For heatmaps, color alone accessibility figures can become especially difficult because the data itself is encoded by color intensity. Use palettes with monotonic lightness when showing ordered values. Add row and column grouping, meaningful labels, and a clear numeric scale. If exact values matter, include annotations or provide a supporting table.
For microscopy and imaging figures, label channels directly. Do not assume readers know that green means one stain and magenta means another. Use arrows, outlines, and panel labels to identify the structure you want readers to notice. Keep annotations thick enough to survive resizing.
Design workflow for accessible scientific figures
You can make accessibility part of your normal figure workflow. It should not be a frantic fix five minutes before submission. Start by deciding what the figure must communicate. Then choose visual encodings that still work if color changes, disappears, or looks different to a reader.
- Write the message first. State the point of the figure in one sentence. This prevents you from adding cues that do not support the message.
- Assign meaning carefully. Decide which variables are categories, values, uncertainty, thresholds, or annotations. Use different cue types for different meaning types.
- Add redundant cues early. Pair color with shape, pattern, line style, labels, or position before the figure becomes crowded.
- Check grayscale. Convert the figure to grayscale or print it. If the categories disappear, revise it.
- Test at final size. View the figure at manuscript column width, poster viewing distance, or slide projection size.
- Ask a real reader. Give someone the figure without explanation. If they cannot identify the main groups, improve the cues.
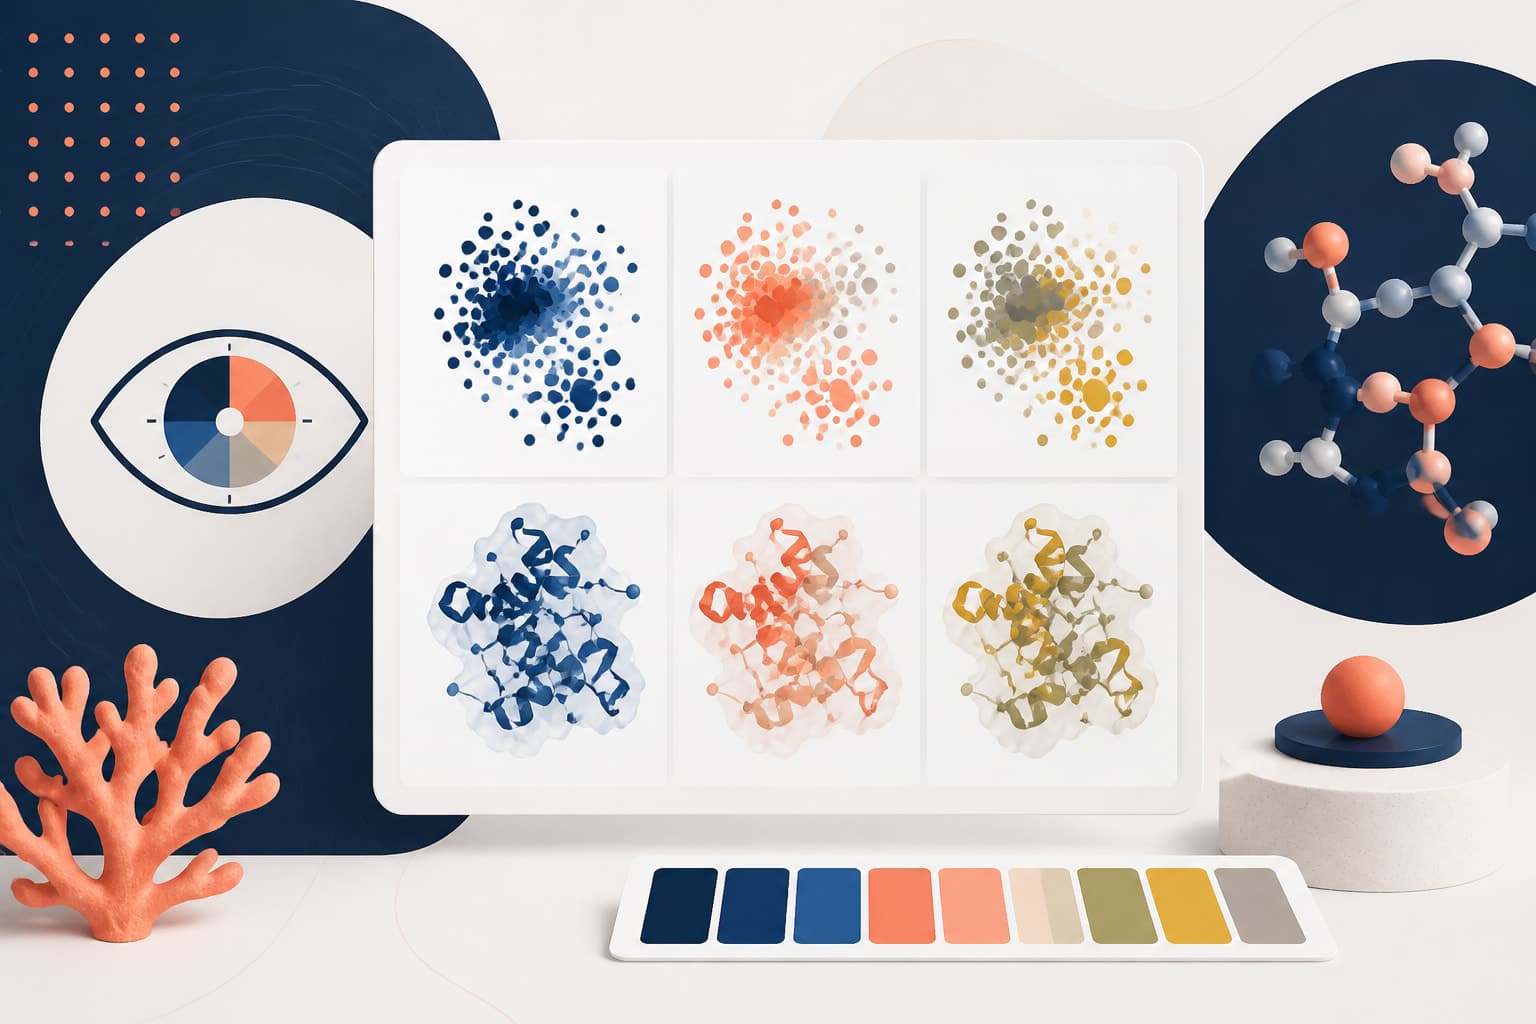
If you use an AI assisted design tool, treat it as a starting point, not a substitute for judgment. You can create with Graffiy to speed up scientific figure design, then review the output for accessibility, labeling, and cue redundancy. The human decision remains important: what must a reader understand, and how many ways does the figure communicate it?

How to choose accessible color palettes
Even though this guide warns against color only meaning, color choice still matters. Start with palettes designed to reduce confusion for common forms of color vision deficiency. Avoid red green contrasts as your only major distinction. Blue orange, purple green, and dark light pairings often perform better, but they still need backup cues.
Use contrast wisely. Two colors may differ in hue but have nearly identical lightness. In grayscale, they can become the same gray. This is why color alone accessibility figures should be checked in grayscale. If two categories become indistinguishable, change their lightness or add stronger non color cues.
For sequential data, choose a palette that moves from light to dark in a predictable way. For diverging data, use a clear midpoint and label it. Avoid rainbow palettes for quantitative data unless you have a strong reason and supporting labels. Rainbow scales can create false boundaries and uneven perceptual steps.
Do not overload a figure with color. Three to five key colors are easier to interpret than ten. If you need many categories, consider grouping, small multiples, or interactive filters in teaching materials. More colors do not always mean more clarity.
Captions and legends are part of accessibility
A figure is not only the plotted marks. Captions, legends, axis labels, and annotations all help readers understand meaning. If your caption says the control group is shown in blue circles and the treatment group in orange triangles, readers get both color and shape cues in text.
Legends should name categories clearly. Avoid cryptic abbreviations unless they are standard for your field. If you must use abbreviations, define them in the caption or legend. Place legends close to the data, and keep the symbol size large enough to read.
Captions should identify the most important visual encodings. For example: Points indicate individual samples, triangles indicate treatment, circles indicate control, and shaded bands show 95 percent confidence intervals. This sentence makes the figure easier to understand for screen magnification users, students, and readers scanning quickly.
Alt text is also valuable for digital teaching resources and online articles. It should summarize the chart type, variables, main trend, and relevant cue system. Do not describe every pixel. Describe the information a reader needs to understand the figure.
Common mistakes to avoid
The first mistake is using red and green as the only distinction. This is still common in biology, medicine, and education. If red means decreased and green means increased, add symbols, labels, or separate panels. Better yet, consider a palette that is easier to distinguish.
The second mistake is using a legend that depends on tiny color swatches. Small squares of similar colors are difficult to match to lines or regions. Use larger swatches, distinctive symbols, and direct labels whenever possible.
The third mistake is adding patterns after the figure is already crowded. Pattern is useful, but it needs space. If patterns make the chart messy, simplify the chart. Split it into panels or show fewer categories at once.
The fourth mistake is assuming accessibility is only for final publication. Educators often reuse draft figures in lectures, labs, and exams. Students deserve accessible visuals too. If a figure teaches a concept, it should not require perfect color perception to understand that concept.
The fifth mistake is ignoring exported formats. A figure may look clear in your design software but degrade in a PDF, slide deck, or learning management system. Always check the final exported version. Compression can blur patterns, thin lines, and small labels.
A quick checklist for color alone accessibility figures
Use this checklist before you submit a paper, post a preprint, teach a lecture, or share a dataset figure. It is intentionally practical. If you answer no to any item, revise the figure before publishing it.
- Can the reader understand all categories if the figure is converted to grayscale?
- Does every color coded category also have a shape, pattern, line style, label, or position cue?
- Are direct labels used where they would reduce legend hunting?
- Are marker shapes and patterns large enough at final display size?
- Does the caption explain the visual encodings, not just the statistical result?
- Are red green distinctions avoided or supported by strong non color cues?
- Does the legend use meaningful names, readable symbols, and enough contrast?
- Have you tested the exported PDF, slide, or image file?
Accessible design is not about making figures dull. It is about making them harder to misunderstand. When you pair color with shape, pattern, and text, your visual message survives more conditions and reaches more readers.
The best research visuals respect the evidence and the audience. Color can guide attention, but it should never be the only path to meaning. Build redundancy into your figures, and you will create clearer science for classrooms, conferences, journals, and public communication.
Frequently Asked Questions
What does color alone accessibility figures mean?
Color alone accessibility figures refers to the rule that a figure should not rely only on color to convey meaning. If a reader cannot distinguish the colors, the information should still be available through shape, pattern, labels, line style, or text.
Can I still use color in accessible research visuals?
Yes, you can and should use color when it improves clarity. The key is to pair color with another cue, such as marker shape, pattern fills, direct labels, or line styles. Color should support the message, not be the only way to read it.
What is the fastest way to check whether a figure uses color alone?
Convert the figure to grayscale or print it in black and white. If groups, thresholds, or annotations become hard to identify, the visual needs another cue. Also check the figure at its final size because small labels and subtle patterns can disappear.
Written by
Shobajo AbdulAzeez
Tags
Share this article