From Sketch to Submission: A Better Graphical Abstract Workflow
In This Article
Creating a polished graphical abstract shouldn't feel like solving a puzzle with missing pieces. Yet most researchers approach this critical visualization with a chaotic mix of scattered sketches, last-minute software downloads, and frantic formatting adjustments. A structured graphical abstract workflow changes everything, transforming what used to be a stressful scramble into a predictable, efficient process that consistently produces professional results.

When you establish a clear workflow, you eliminate the guesswork that consumes hours of valuable research time. Instead of wondering what comes next or how to fix formatting problems at the last minute, you follow proven steps that guide you from initial concept to submission-ready export. This systematic approach doesn't just save time. It improves the quality of your visual communication and reduces the stress associated with creating graphical abstracts under tight deadlines.
Why Most Graphical Abstract Workflows Fail
The typical researcher's approach to creating graphical abstracts resembles a treasure hunt without a map. You start with a rough idea, maybe sketch something on paper, then jump into whatever design software seems available. Midway through, you realize the layout doesn't work. You restart with different software, discover the image resolution is wrong, panic about file formats, and eventually submit something that barely represents your original vision.
This scattered approach fails because it lacks structure and predictability. Without defined phases, you make decisions reactively rather than strategically. You might spend hours perfecting one element while neglecting overall composition. Or you could discover technical requirements too late in the process, forcing major revisions when time is running short.
Research teams compound these problems when they lack standardized processes. One member creates abstracts using PowerPoint, another prefers Adobe Illustrator, and a third experiments with online tools. This inconsistency makes collaboration difficult and creates knowledge silos that slow down future projects.
The absence of quality checkpoints also creates problems. Without systematic review stages, errors and inconsistencies slip through unnoticed. Typography might be inconsistent, color schemes could clash with journal requirements, or technical accuracy might suffer in favor of visual appeal. These issues become expensive to fix when discovered late in the submission process.
Planning Your Graphical Abstract Workflow Strategy
A successful workflow begins with strategic planning, not software selection. Before you touch any design tools, you need clarity about your story, your audience, and your constraints. This planning phase determines whether your final product will effectively communicate your research or simply fill a submission requirement.
Start by defining your core message in one clear sentence. What single insight do you want readers to understand immediately? This sentence becomes your north star throughout the design process. Every visual element should support this central message, not compete with it for attention.
Next, research your target publication's specific requirements. Journals vary significantly in their graphical abstract specifications. Some prefer landscape orientation while others require square formats. Color requirements, file size limits, and resolution specifications differ between publishers. Document these constraints early to avoid costly revisions later.
Consider your audience's expertise level and viewing context. A graphical abstract for a specialized journal can assume more technical knowledge than one intended for a broad scientific audience. Similarly, abstracts viewed primarily on mobile devices need different design considerations than those displayed on large conference screens.
Allocate realistic time for each workflow phase. Most researchers underestimate the time required for iteration and refinement. A typical graphical abstract workflow requires several days of work spread across concept development, design creation, review cycles, and final optimization. Rushing through these phases inevitably compromises quality.
The Complete Graphical Abstract Workflow Framework
An effective graphical abstract workflow consists of five distinct phases, each with specific objectives and deliverables. This structure provides checkpoints for quality control while maintaining momentum toward your deadline.
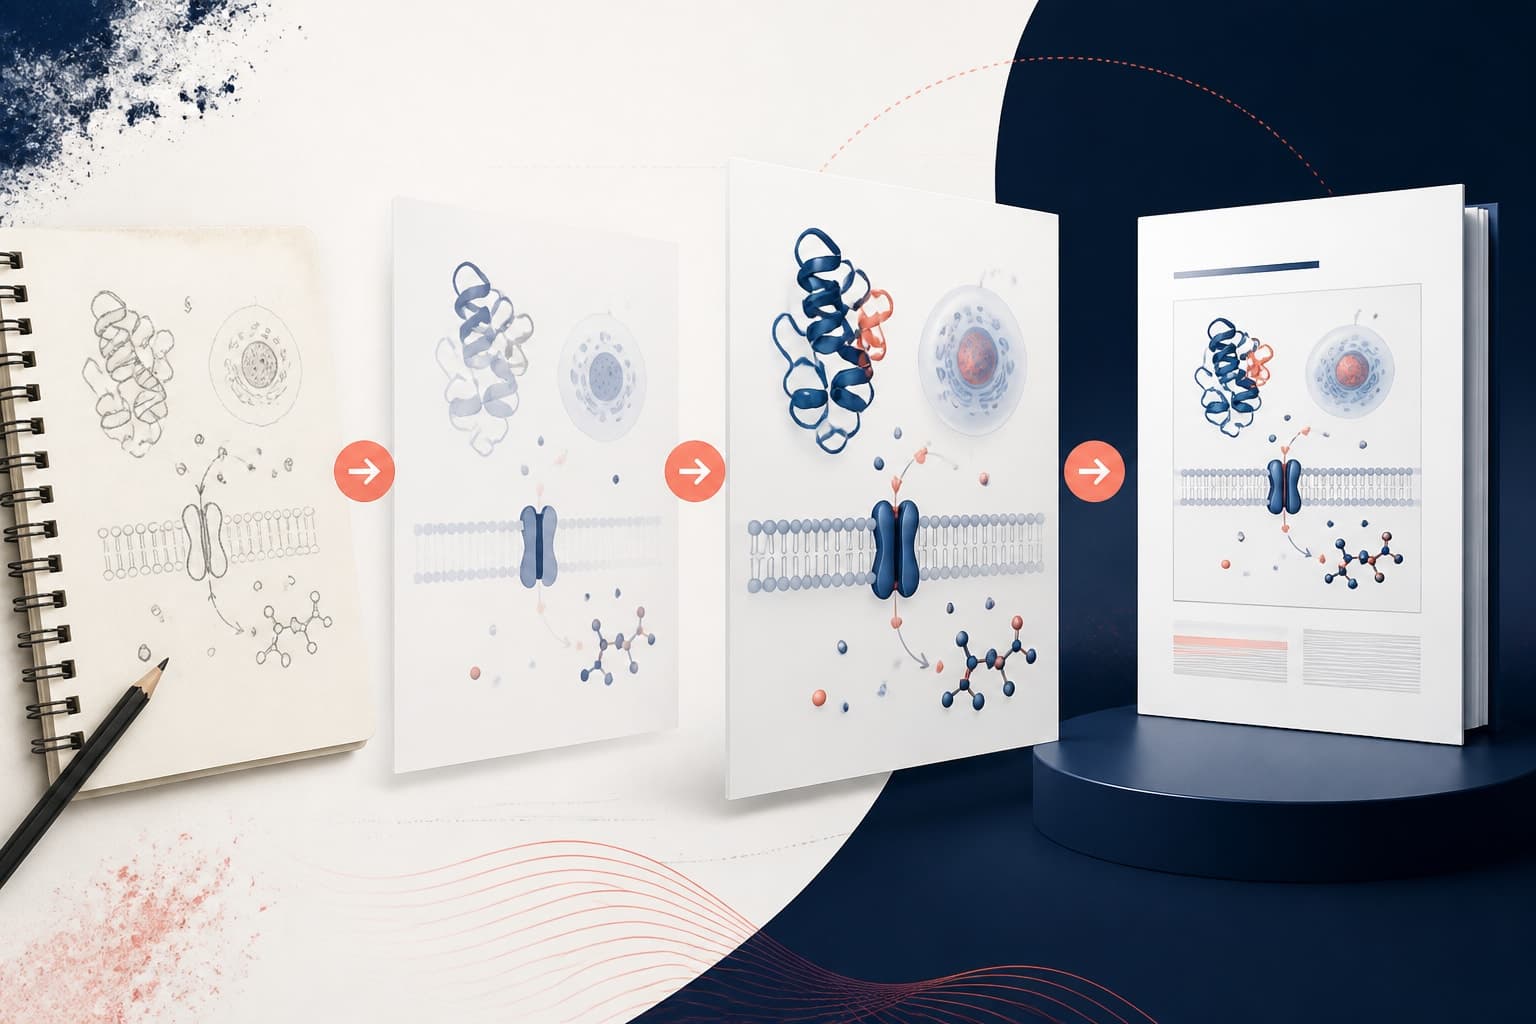
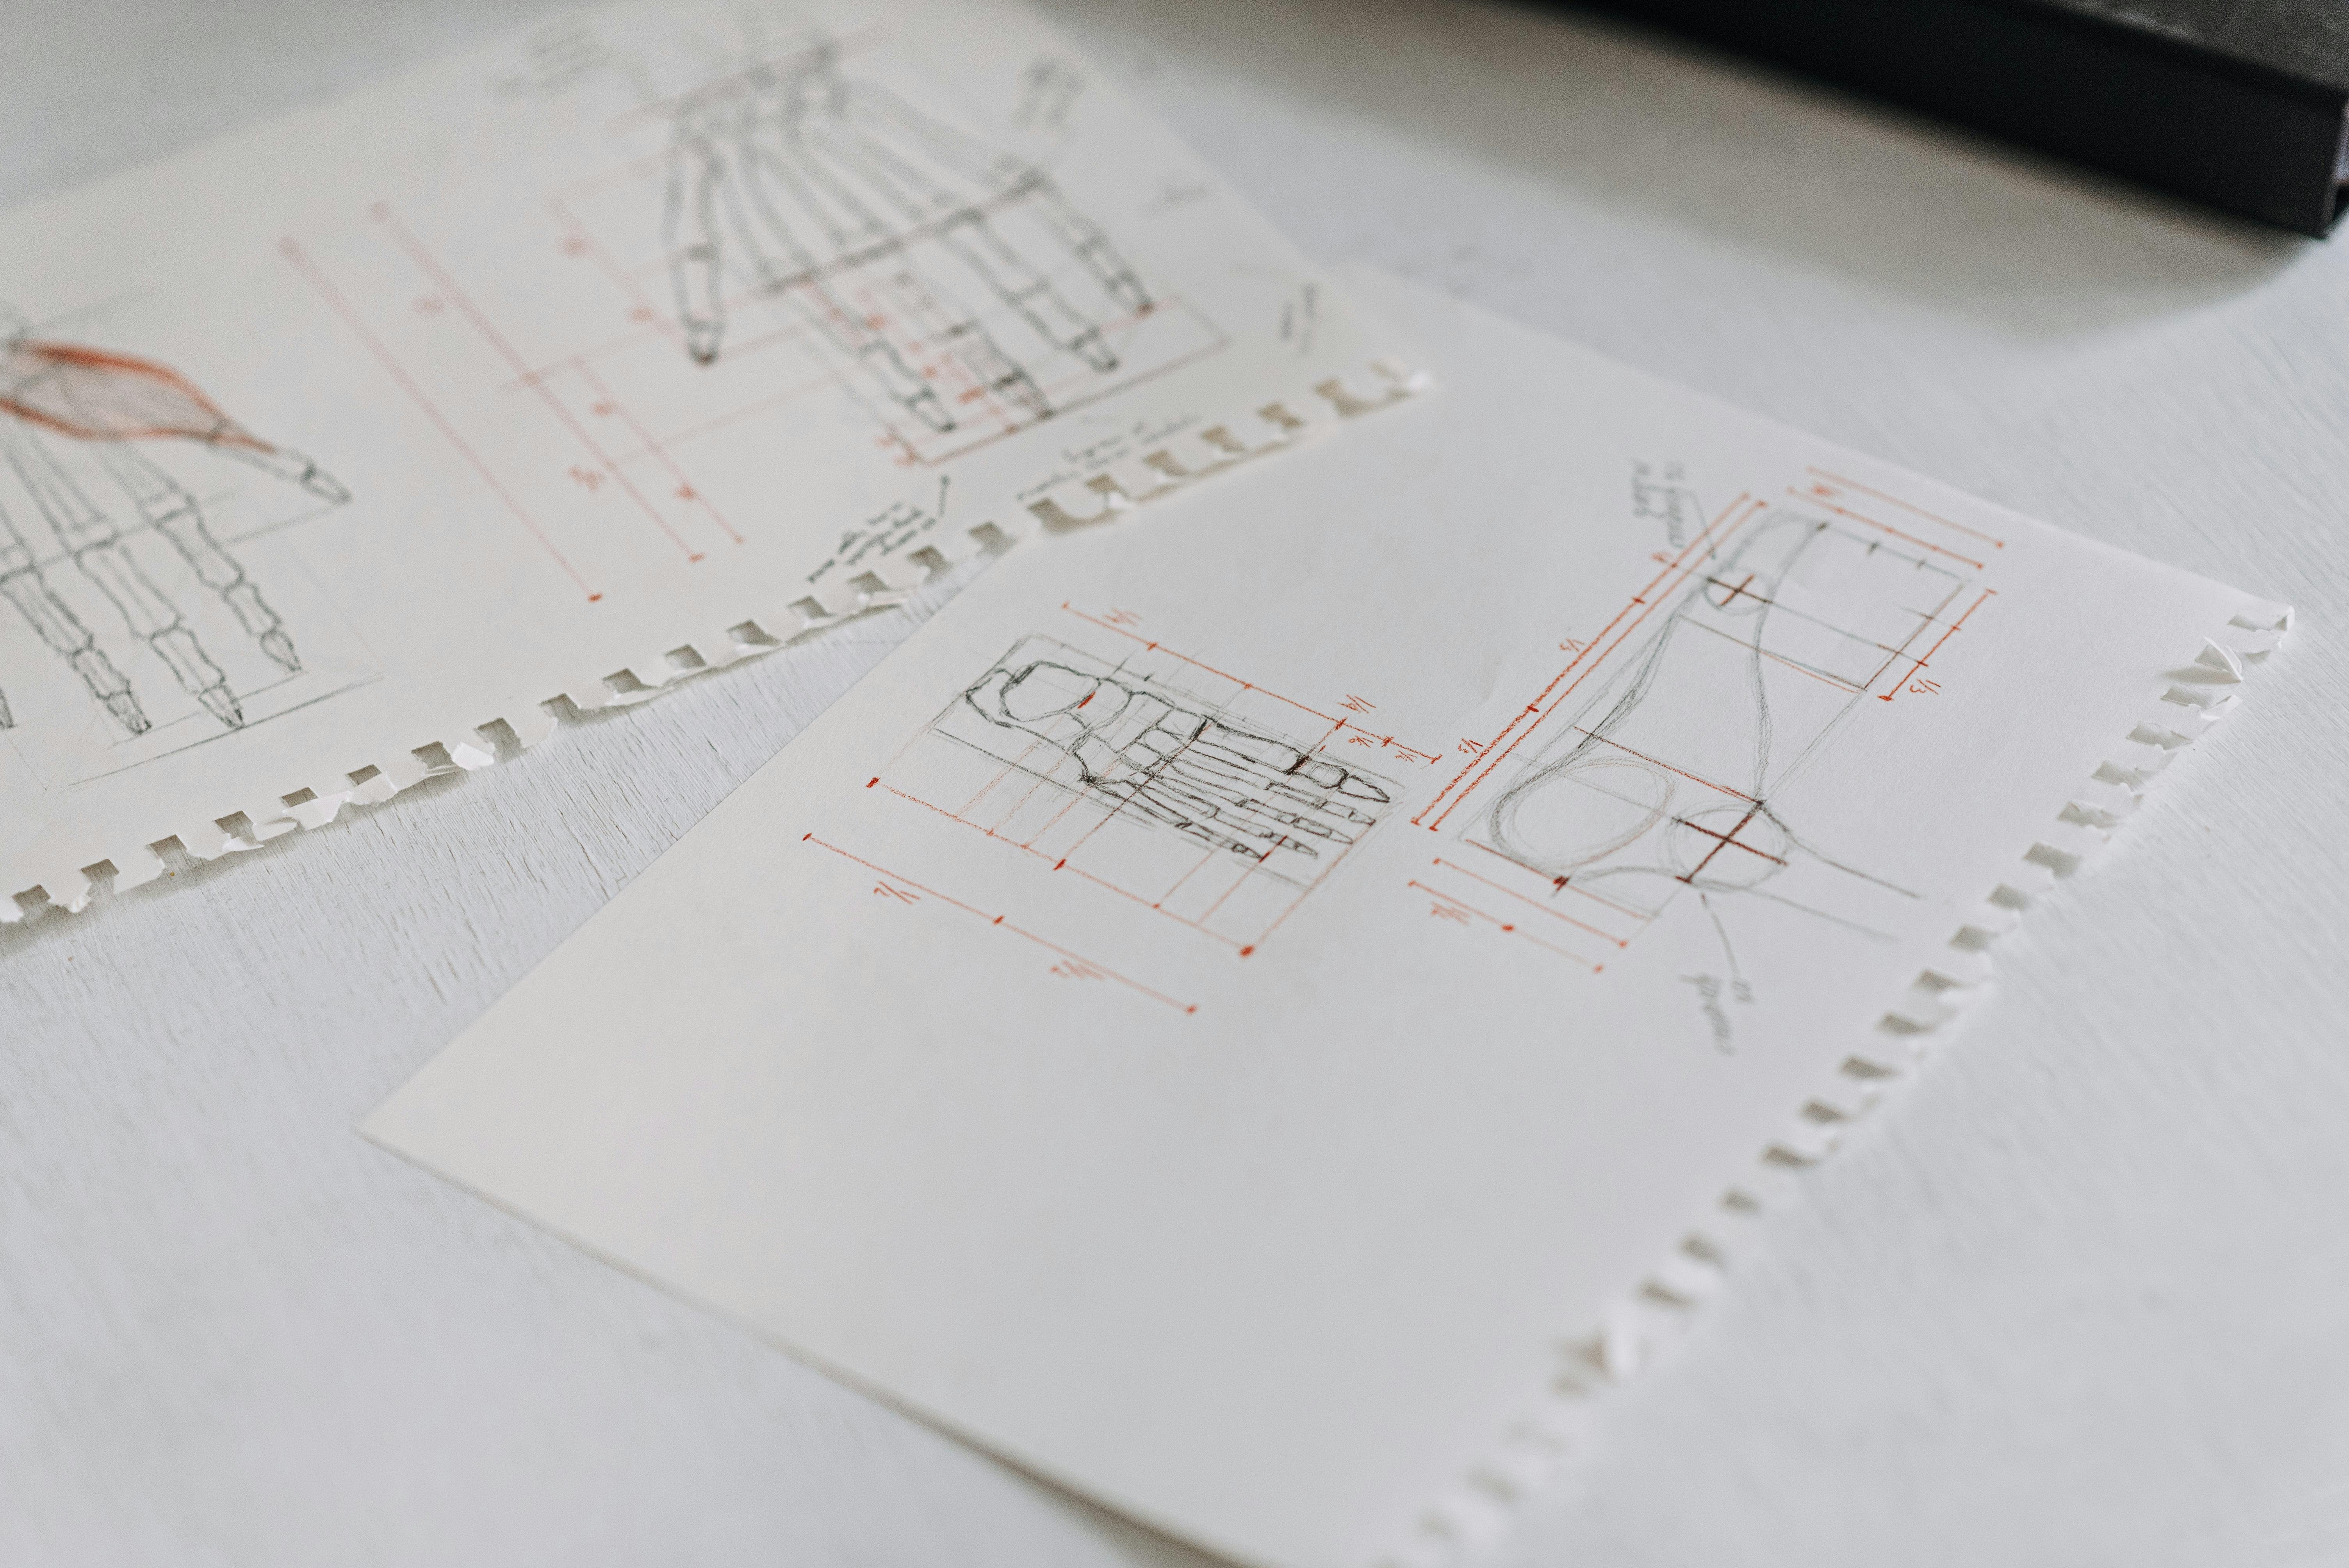
Phase one focuses on concept development and story structure. During this stage, you transform your research findings into a visual narrative. Start by identifying the three to five key steps or components that tell your story. Arrange these elements in logical sequence, considering both chronological flow and visual hierarchy. Sketch rough layouts on paper or use simple digital wireframes to explore different arrangements.
Phase two involves creating your initial design using professional tools. Whether you create with Graffiy or use traditional design software, this phase translates your sketches into digital form. Focus on establishing the overall composition, color scheme, and typography hierarchy. Don't worry about perfection at this stage. The goal is creating a solid foundation for refinement.
Phase three centers on iteration and refinement. This is where good abstracts become great ones. Review your design against your original objectives. Does it clearly communicate your core message? Are the visual elements balanced and easy to follow? Gather feedback from colleagues and incorporate their insights. Make multiple versions to test different approaches.
Phase four addresses technical optimization and compliance. Verify that your design meets all journal requirements for size, resolution, and file format. Check that text remains readable at required viewing sizes. Ensure color schemes work for colorblind readers and print publications. Test your design on different devices and backgrounds.
Phase five completes the process with final review and export. Conduct a comprehensive quality check covering scientific accuracy, visual consistency, and technical specifications. Export files in required formats with appropriate naming conventions. Create backup copies and document any special requirements for future reference.
Tools and Templates That Streamline Your Process
The right tools can dramatically accelerate your workflow while maintaining professional quality. However, tool selection should support your process, not dictate it. Choose platforms that integrate well with your existing workflow and provide the specific features your research visualization requires.
Professional design platforms offer advantages beyond basic drawing capabilities. They provide templates specifically designed for scientific communication, ensuring proper proportions and typography hierarchy from the start. Many include icon libraries with scientific symbols and molecular structures, eliminating the need to create common elements from scratch.
Template systems deserve special consideration because they standardize visual consistency across your research team. When everyone starts with the same foundational elements, collaboration becomes smoother and quality becomes more predictable. Templates also reduce decision fatigue by providing proven layouts and color schemes.
According to research published in Nature Communications, visual abstracts significantly increase article engagement and citation rates. This evidence supports investing time in proper tools and processes rather than rushing through design creation with inadequate resources.
Version control becomes crucial when working with design files. Unlike text documents, visual files don't merge easily when multiple people make changes. Establish naming conventions that include version numbers, dates, and contributor initials. Use cloud storage systems that preserve edit history and prevent accidental overwrites.
Consider automation opportunities within your workflow. Many repetitive tasks like resizing, format conversion, and quality checks can be automated or semi-automated. This automation frees up time for the creative and strategic aspects of design that actually require human expertise.

Quality Control and Review Processes
Systematic quality control separates professional graphical abstracts from amateur attempts. Without structured review processes, even experienced designers miss important issues that could have been caught with proper checkpoints.
Establish multiple review criteria rather than relying on subjective aesthetic judgment. Scientific accuracy should be verified by subject matter experts who can catch technical errors that designers might miss. Visual clarity needs assessment by people unfamiliar with your specific research, ensuring that your abstract communicates effectively to broader audiences.
Technical compliance requires separate verification using journal-specific checklists. File size, resolution, color mode, and format specifications must be confirmed before submission. Many journals provide detailed technical requirements, but these are often overlooked until the last minute when corrections become rushed and stressful.
Accessibility considerations deserve attention during review phases. Design choices that seem minor can significantly impact comprehension for readers with visual impairments or color vision deficiencies. High contrast ratios, readable font sizes, and alternative text descriptions improve accessibility without compromising visual appeal.
Time your review processes strategically within your workflow. Initial reviews should focus on concept and story structure before investing significant time in visual refinement. Later reviews can address technical details and compliance issues. Final reviews should be comprehensive but brief, focusing on catching any remaining issues rather than making major changes.
Document your review findings and resolutions for future reference. This documentation helps improve your workflow over time and provides valuable context if revisions are requested during the publication process. Teams benefit from shared review checklists that ensure consistent quality standards across different projects and contributors.
Common Pitfalls and How to Avoid Them
Even well-intentioned researchers make predictable mistakes that derail their graphical abstract workflow. Understanding these common pitfalls helps you avoid wasting time on preventable problems.
Overcomplication ranks among the most frequent errors. Researchers often try to include too much information, resulting in cluttered designs that confuse rather than clarify. Remember that graphical abstracts should highlight key insights, not reproduce your entire methodology. If you can't explain your abstract's story in thirty seconds, it's probably too complex.
Poor typography choices undermine otherwise strong designs. Using too many fonts, inappropriate sizes, or insufficient contrast makes your abstract difficult to read. Establish a clear hierarchy using no more than two font families. Ensure that text remains legible when your abstract is displayed at various sizes and resolutions.
Ignoring journal requirements until late in the process creates unnecessary stress and often forces design compromises. Publishers have specific technical requirements for good reasons, usually related to printing limitations or online display standards. Build these constraints into your initial planning rather than treating them as afterthoughts.
Inadequate color management causes problems when abstracts are printed or displayed on different devices. Colors that look vibrant on your computer monitor might appear dull in print or become invisible to colorblind readers. Use color-safe palettes and test your designs under different viewing conditions.
Skipping the feedback phase deprives you of valuable perspectives that could improve your communication effectiveness. Colleagues can spot confusing elements, suggest clearer arrangements, or catch technical errors that you've become blind to through extended exposure to your own work. Plan time for multiple feedback rounds rather than treating review as an optional final step.

Optimizing Your Workflow for Team Collaboration
Research teams need collaborative workflows that maintain quality while accommodating different skill levels and time constraints. Individual workflows often break down when multiple people contribute to the same project or when team members have varying design experience.
Standardized templates and style guides create consistency across team members. When everyone starts with the same visual foundation, collaboration becomes more efficient and results become more professional. Develop templates that include your institution's color schemes, approved fonts, and common scientific symbols.
Role definition prevents duplication of effort and ensures that tasks align with individual strengths. Some team members excel at concept development while others prefer technical implementation. Clear role assignments help people focus on their contributions without stepping on each other's work.
File sharing and version control require special attention in team environments. Multiple people editing the same design file creates conflicts and confusion. Use platforms that support real-time collaboration or establish clear checkout procedures for design files. Maintain central libraries of approved assets like logos, icons, and template files.
Communication protocols keep everyone informed about project status and requirements. Regular check-ins help catch problems early when they're easier to fix. Document decisions and changes so team members understand the reasoning behind design choices and can maintain consistency in future work.
Training investments pay dividends over time. Teaching team members basic design principles and tool proficiency improves the quality of their contributions and reduces bottlenecks around specialized skills. Consider both formal training programs and informal mentoring relationships to build team capabilities.
Measuring and Improving Your Workflow Performance
Continuous improvement transforms good workflows into excellent ones. Without measurement and analysis, you miss opportunities to eliminate inefficiencies and enhance quality. Track both quantitative metrics and qualitative feedback to guide your optimization efforts.
Time tracking reveals where your workflow consumes unnecessary resources. Document how long each phase requires across different projects. Look for patterns that indicate bottlenecks or inefficiencies. Some steps might consistently take longer than expected, suggesting opportunities for better tools or processes.
Quality metrics help you balance efficiency with effectiveness. Track how often you need to make major revisions after initial completion. Monitor feedback from journal editors and peer reviewers. Count how many abstracts meet technical requirements on the first submission attempt versus those requiring corrections.
Team satisfaction surveys provide insights into workflow pain points that might not be obvious from productivity metrics alone. Are team members frustrated with certain tools or processes? Do they feel confident about their design skills? Understanding these qualitative factors helps you address systemic issues that affect long-term performance.
Benchmark your performance against industry standards and best practices. Compare your turnaround times with typical industry expectations. Evaluate your quality outcomes against published guidelines for effective scientific visualization. Use external feedback to identify areas where your workflow might be falling short of professional standards.
Regular workflow reviews should be scheduled rather than triggered by problems. Quarterly assessments allow you to incorporate lessons learned from recent projects while the details are still fresh. Annual reviews provide opportunities for more significant process changes or tool upgrades based on accumulated experience and changing requirements.
Innovation opportunities often emerge from systematic analysis of your workflow data. Patterns in your time allocation might suggest opportunities for automation. Recurring quality issues could indicate needs for better templates or training. Successful experiments by team members might be scalable across the entire organization.
Frequently Asked Questions
How long should a complete graphical abstract workflow take from start to finish?
A well-structured graphical abstract workflow typically requires 3-5 days spread across planning, design, review, and refinement phases. Rushing through the process usually results in lower quality outcomes and more revisions later. Factor in time for feedback rounds and technical optimization to avoid last-minute stress.
What are the most important steps in a graphical abstract workflow?
The most critical steps include initial concept planning, creating a clear visual hierarchy, gathering feedback from colleagues, and verifying technical compliance with journal requirements. Many researchers skip the planning phase and rush to design tools, which often leads to confusion and wasted effort later in the process.
How can research teams standardize their graphical abstract workflow across different projects?
Teams should develop shared templates, style guides, and quality checklists that ensure consistency regardless of who creates the abstract. Establish clear role definitions and file management procedures to prevent conflicts. Regular training sessions help team members maintain proficiency with tools and processes as requirements evolve.
Written by
Shobajo AbdulAzeez
Tags
Share this article